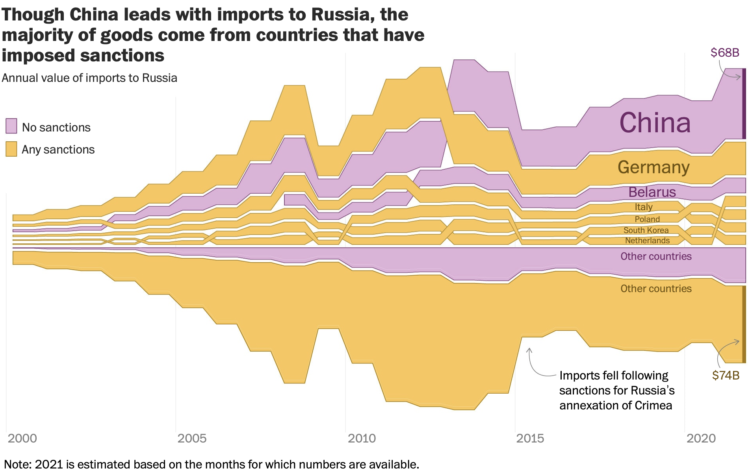
For The Washington Post, Andrew Van Dam, Youjin Shin and Alyssa Fowers plotted the value of imports to Russia by country and whether that country has imposed sanctions or not.
The bumpy alluvial diagram shows values and rank over time with “other countries” split out on the bottom. I wonder if it would’ve been worth splitting no-sanction and sanction countries for the top and bottom instead.


