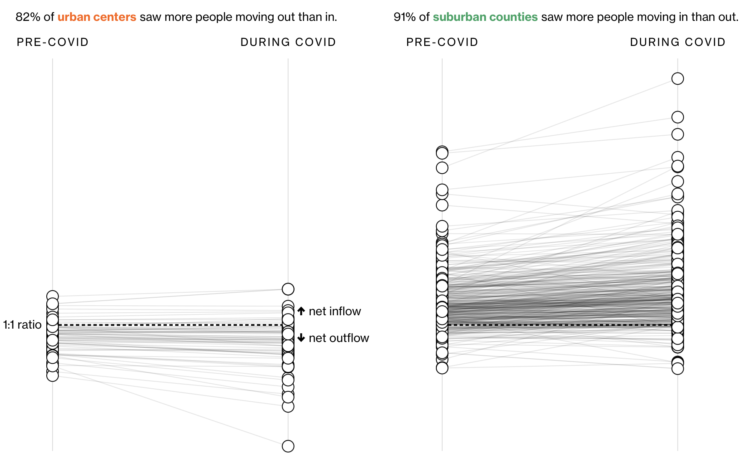
In another look at migration through the lens of USPS change of address data, Bloomberg CityLab shows where people moved during the pandemic, focusing on movement in and out of metro areas. With the exception of San Francisco and New York, most areas didn’t see much movement distance-wise:
Even in the biggest metro areas, most people didn’t go very far. In the country’s 50 most populous cities, 84% of the moves were to somewhere within the perimeter of the central metro area, down just slightly from pre-pandemic levels. Many of the most local moves were likely related to the economic downturn: A February Pew Research Center survey of those who moved during the pandemic found that the most common reason people cited was financial distress including job loss.
See also similar conclusions by The New York Times and Financial Times.
While there wasn’t the mass exodus that some imagined, the pandemic did seem to speed up some trends. So as we wait for the 2020 Census count, which comes out out this afternoon, it’ll be interesting to see if the rate of change continues in the coming years.


