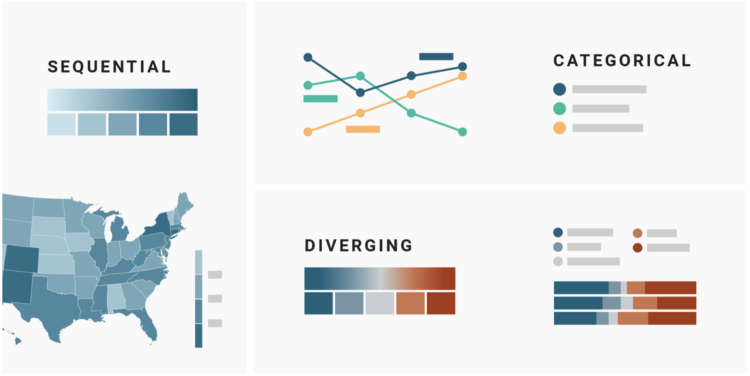
On a superficial level, color scale selection seems like a straightforward task. Pick a sequence of colors that looks like it goes from light to dark. Done. But right when you get into it, you might find the process isn’t so straightforward. Different color scales can represent different aspects of your data, and poor selection can lead to poor communication. So, Lisa Charlotte Rost for Datawrapper wrote a four-part practical guide to help you figure it out.
See also Rost’s equally useful guide on what colors to pick for your scales.
 Visualize This: The FlowingData Guide to Design, Visualization, and Statistics (2nd Edition)