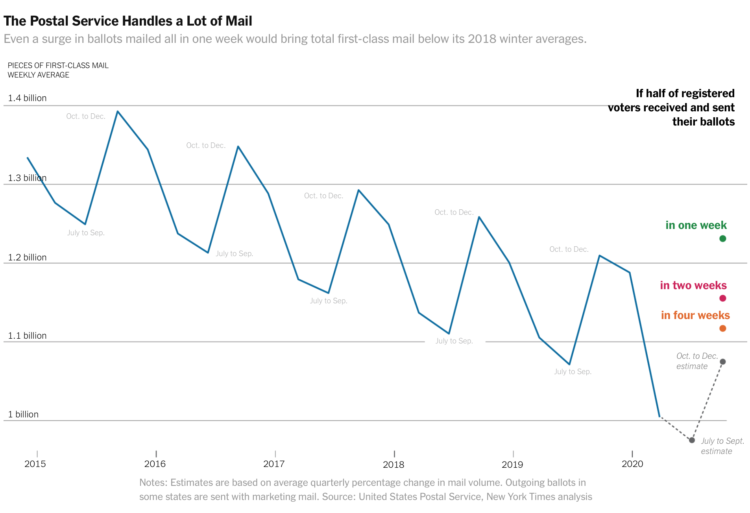
The volume of mail-in ballots will likely be higher than usual this year, but relative to the Postal Service’s usual volumes from years past, the bump doesn’t seem unfathomable. The chart above, which shows average weekly volume over the years, from Quoctrung Bui and Margot Sanger-Katz for NYT’s The Upshot, shows the scale.
Of course, if certain administrations continue to hamper USPS operations, that’s a different story.


