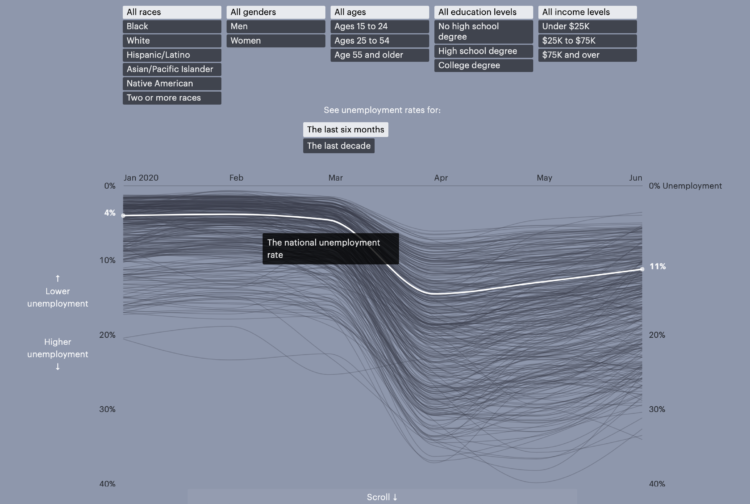
Unemployment has hit the United States hard over the past several months, for some harder than others. Lena Groeger reporting for ProPublica:
Part of the reason for this disparity is that many workers of color, especially Black workers, didn’t come into the crisis on equal footing. At the beginning of 2020, when the U.S. was at what most would have considered peak economic prosperity, the unemployment rate for Black workers was more than double that of their white counterparts. “The classic fact about Black unemployment,” said William Darity Jr., an economist at Duke University who studies racial inequality, “is that it’s been two times the white rate since we started measuring it.”
Each line represents a different subpopulation, so you can scroll over specific lines or select specific groups with the buttons. It’s similar to this New York Times interactive from 2009.
But this is 2020, so Groeger uses the overview as the initial view and then it shifts into scrollytelling. Groups highlight and the time frame expands as you read. This eventually takes you back to the initial view, where you’re invited to explore the data.
The overview first provides an opportunity for the reader to set a baseline as it relates to their own demographic. Then you see how specific groups are different or similar to that baseline. At the end, with a different baseline set, you can compare one more time.


