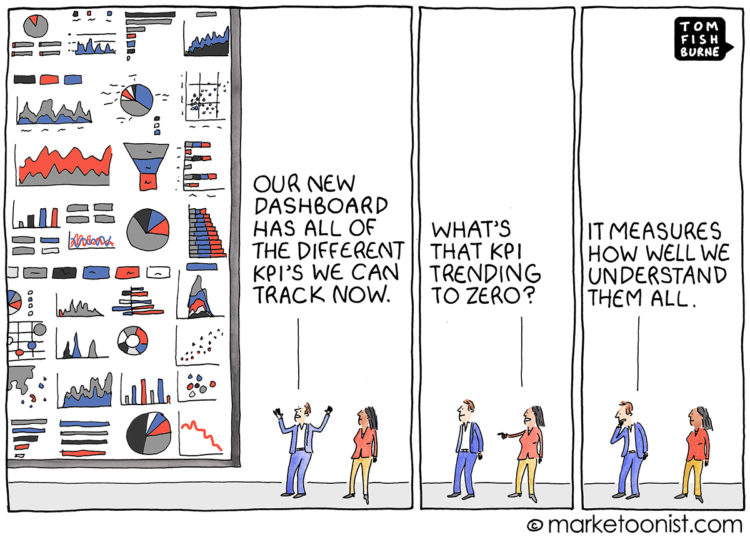
From Tom Fishburne, the Marketoonist. Maybe a dashboard isn’t the answer you’re looking for.
KPI overload
Second Edition
 Visualize This: The FlowingData Guide to Design, Visualization, and Statistics (2nd Edition)
 Visualize This: The FlowingData Guide to Design, Visualization, and Statistics (2nd Edition)
New tools, refined process.