World map shows aerosol billowing in the wind
Aug 24, 2018

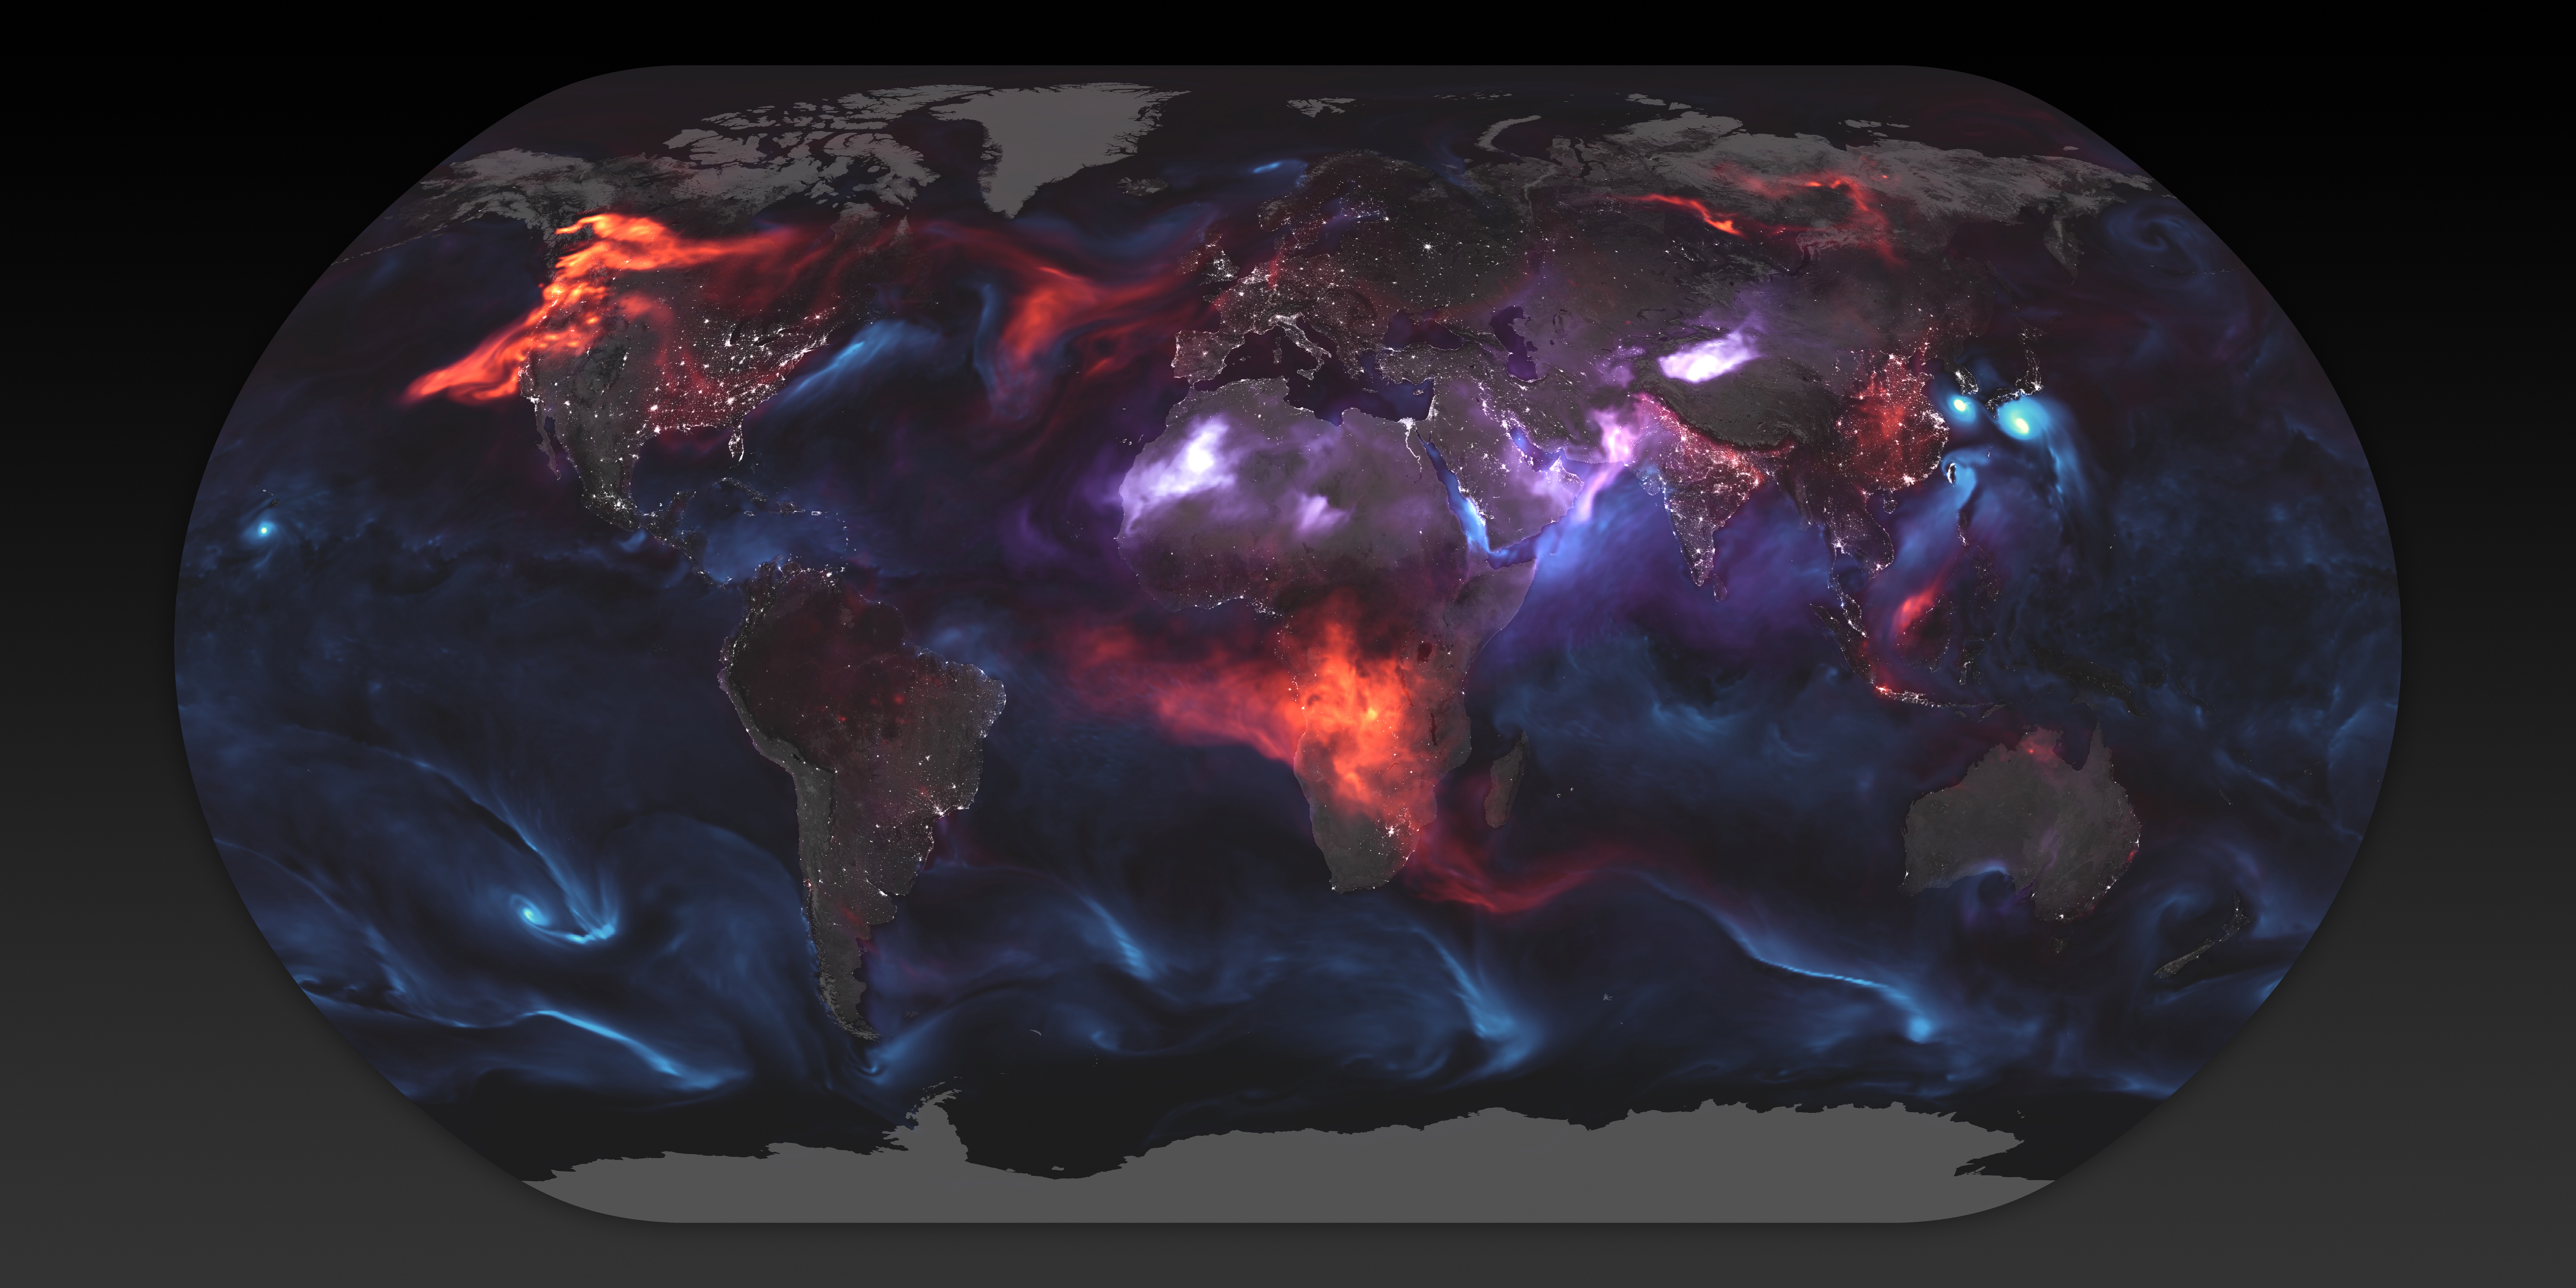
Using a mathematical model based on satellite data, NASA shows an estimate of aerosol in the atmosphere on August 23, 2018:

The visualization above highlights GEOS FP model output for aerosols on August 23, 2018. On that day, huge plumes of smoke drifted over North America and Africa, three different tropical cyclones churned in the Pacific Ocean, and large clouds of dust blew over deserts in Africa and Asia. The storms are visible within giant swirls of sea salt aerosol (blue), which winds loft into the air as part of sea spray. Black carbon particles (red) are among the particles emitted by fires; vehicle and factory emissions are another common source. Particles the model classified as dust are shown in purple. The visualization includes a layer of night light data collected by the day-night band of the Visible Infrared Imaging Radiometer Suite (VIIRS) on Suomi NPP that shows the locations of towns and cities.

Gnarly.

Become a member. Support an independent site. Make great charts.

See What You Get

Learn to Visualize Data See All →

How to Make Frequency Trails in Excel

Also known as ridgelines, use the method to create a compact visualization where you can easily identify major patterns and outliers.

Drawing Lines and Segments in R

Show connections and changes over time with start and end points.

How to Make Print-ready Graphics in R, with ggplot2

You don’t have to use illustration software to polish your graphics. If keeping everything in R is your thing, this tutorial is for you.

How to Make Bubble Clusters in R

Represent individual counts with grouped units to make data feel less abstract.

Favorites

10 Best Data Visualization Projects of 2017

It was a rough year, which brought about a lot of good work. Here are my favorite data visualization projects of the year.

The Best Data Visualization Projects of 2014

It’s always tough to pick my favorite visualization projects. Nevertheless, I gave it a go.

How Much Minimum Wage Changed in Each State

Minimum wage has increased over the years, but by how much depends on where you live.

Top Brewery Road Trip, Routed Algorithmically

There are a lot of great craft breweries in the United States, but there is only so much time. This is the computed best way to get to the top rated breweries and how to maximize the beer tasting experience. Every journey begins with a single sip.