Lisa Charlotte Rost for Datawrapper provides guidance for designing choropleth maps that most fairly represent your data:
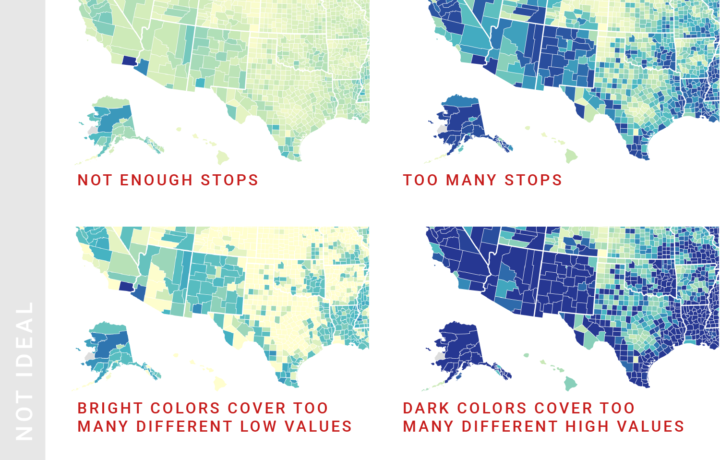
Maps are not objective, but a version of reality. When creating them, lots of choices are made: What to map, how to map and whether or not to use a map in the first place. Here we’ll try to find guidelines to all of these questions, for a specific subset of maps: Choropleth maps (the ones in which each region is filled with a color that represents a value).
Rost’s other guides (line charts, area charts, pie charts, and more) are also full of practical advice. Highly recommended.
 Visualize This: The FlowingData Guide to Design, Visualization, and Statistics (2nd Edition)