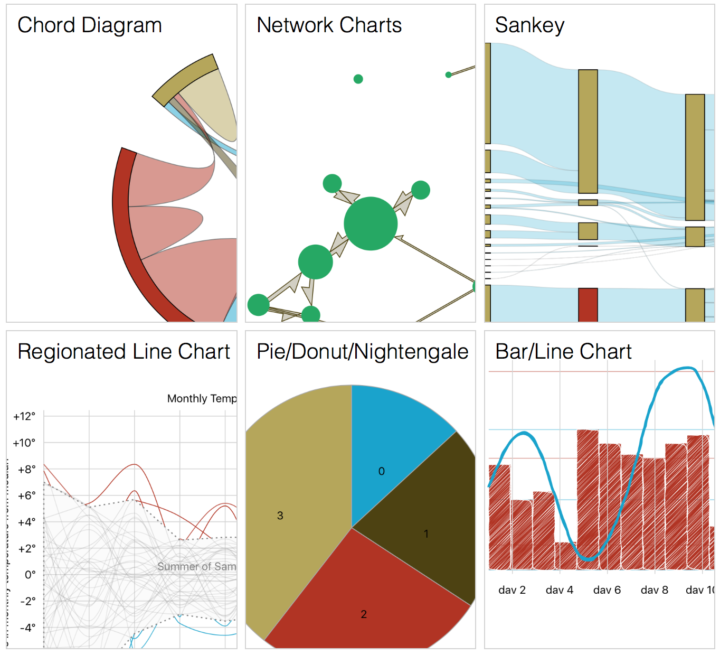
Elijah Meeks released Semiotic into the wild. It’s a framework that allows quick charts but provides flexibility for custom stuff.
Semiotic is a React-based data visualization framework. You can see interactive documentation and examples here. It satisfies the need for reusable data visualization, without committing to a static set of charting types. It came out of a need for a data visualization framework that let us make simple charts quickly without committing ourselves to using only those charts. Semiotic incorporates the design and functionality of more complex data visualization methods as a response to the conversation these simple charts might begin.
Saving this for later, if just for the sketchy fills.


