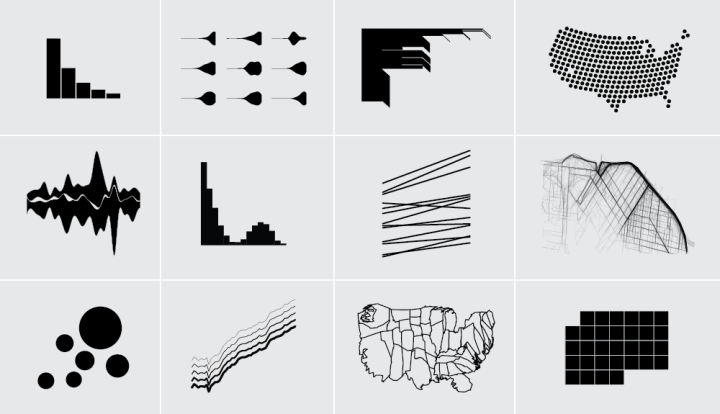
There are many click-and-play software programs, solutions, and tools to help you visualize your data. They can be super helpful and you can get a lot done without a single line of code. However, being able to code your own visualization carries its own benefits like flexibility, speed, and complete customization.
It’s fun — once you know what you’re doing. And that’s the kicker. It takes time to learn to program, and most of us don’t have the minutes to spare. But still, I think it’s worth the added effort up front for the long-term benefits.
Here are some tips to get you started, based on my own experiences with R, and more recently, the JavaScript library d3.js.
Use the software you’re most comfortable with
Learning to code for visualization doesn’t mean abandoning the tools you’re already familiar with. I use whatever gets me from point A to point B the fastest, and if that means Excel, Google Sheets, or Python, then that’s what I use.
You don’t have to do everything in R or in JavaScript. There are benefits to keeping it all encapsulated, but your goal in the beginning is to make a graph. The visual outputs motivate you to take another step. Worry about the “right” way to do things later.
Work through the basics
Don’t expect to make the most advanced and breathtaking visuals you ever saw in your first go. Don’t expect plug-and-play. There’s a lot of uphill climbs in the beginning, so start with the basics and work your way up to more advanced techniques. That way you don’t get discouraged right away and abandon all hope.
In R, there are a lot of packages that sometimes do all the work for you, and you can get something fun with just a single function call. But if you aren’t familiar with R syntax, even that can confuse, which is why I start with the very basics of R in the four-week course.
This is a bigger deal with d3.js, which like I said, is a JavaScript library. If you don’t know JavaScript and are new to programming, many examples can seem like a jumble. Start with the first handful of tutorials by Mike Bostock to get a feel for what you’re dealing with.
Pick a project and do it
 That said, don’t get caught up in learning everything there is to know about the universe before you work on a project. Just cover the basics, so that when you google for solutions or for the inevitable errors that arise, you can make sense of the search results.
Find some data and get visualizing. You progress slowly at first and there will be much confusion. Perfectly normal. I’m still constantly confused, but the key is to work through it.
You benefit from this approach, because it forces you to learn exactly what you need to know. With every project, the next one gets easier.
Read the docs and look at examples
Documentation is your friend. It’s a bit confusing at first, but you get used to it. When something doesn’t work for you, it’s usually a good bet that you did something wrong rather than the implementation is incorrect, so read through documentation carefully to make sure you’re using a function right.
In R, documentation follows the same format for every function. It tells you what parameters the function takes, what the function returns, and ends with examples on how to use the function. Those examples at the end are golden.
Similarly, d3.js is well-documented by its creator Mike Bostock, and there are many tutorials and guides on the internets. Bostock’s large collection of examples is particularly useful. When I run into an issue, I typically google the error with “mbostock” appended to the end.
Just get it to work
I still have trouble with this one, but if you can follow this tip, you will save yourself a lot of time. There is often a best or optimum way to create a visualization in a given language. Don’t try to optimize in the beginning. Just get the shapes and colors to appear on the screen and encode your data in a way that is visually accurate.
If the visualization drags (for the interactive and animated stuff) then optimize. More often than not, your chart will probably be fine without any optimizations.
Okay, that’s all. Go visualize your data already.
Additional resources


