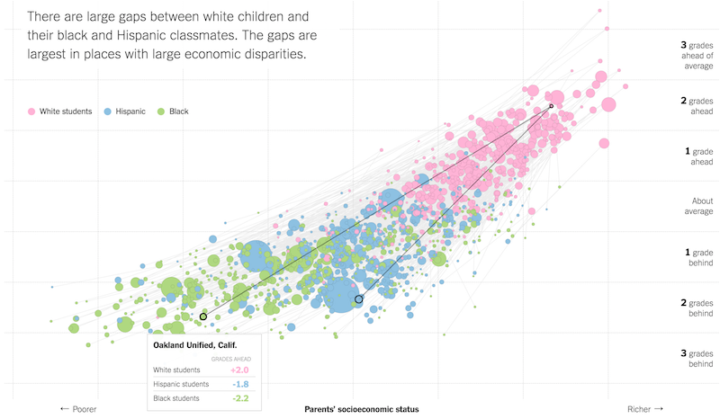
The Upshot highlights research from the Stanford Center for Education Policy Analysis that looks into the relationship between a child’s parents’ socioeconomic status and their educational attainment. Researchers focused on test scores per school district in the United States.
Children in the school districts with the highest concentrations of poverty score an average of more than four grade levels below children in the richest districts.
Even more sobering, the analysis shows that the largest gaps between white children and their minority classmates emerge in some of the wealthiest communities, such as Berkeley, Calif.; Chapel Hill, N.C.; and Evanston, Ill. (Reliable estimates were not available for Asian-Americans.)
Be sure down to browse the chart the shows points for race within the the same school districts. Color represents race, and connecting lines between dots show the magnitude of the differences between white, Hispanic, and black.
If you’re interested in the data itself, you can download it from the Stanford Education Data Archive.
See also the education spending map from NPR, which suddenly takes on a new dimension.


