How to Map and Use GeoTIFF Files in R
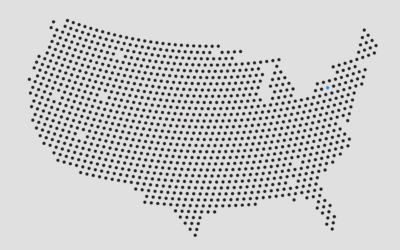
It’s like working with a bunch of tiny dots, and oh look, all of sudden patterns emerge.
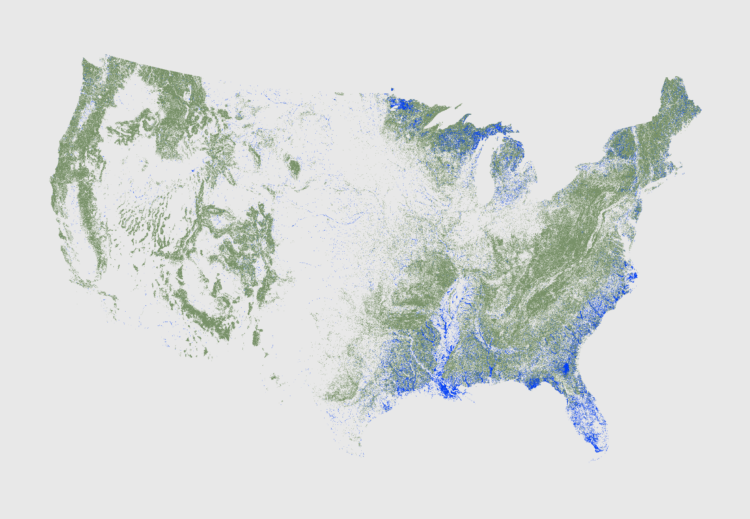
TIFF, a raster file format, encodes images as a matrix where each cell indicates the color in a corresponding spot on the image. GeoTIFF, a relativey new file format, adds to that with metadata about map projections, coordinate systems, and the data points themselves.
The format is useful when the spatial data isn’t restricted to polygons (in which a shapefile might be the better option). It’s common with satellite data.
The data can seem daunting at first, because the files can get pretty big and you can easily run out of memory during the process if you don’t pay attention. But once you know how to handle the big files, the mapping part is more straightforward.
To access this full tutorial, you must be a member. (If you are already a member, log in here.)
Get instant access to this tutorial and hundreds more, plus courses, guides, and additional resources.
Membership
You will get unlimited access to step-by-step visualization courses and tutorials for insight and presentation — all while supporting an independent site. Files and data are included so that you can more easily apply what you learn in your own work.
Learn to make great charts that are beautiful and useful.
Members also receive a weekly newsletter, The Process. Keep up-to-date on visualization tools, the rules, and the guidelines and how they all work together in practice.
See samples of everything you gain access to:

