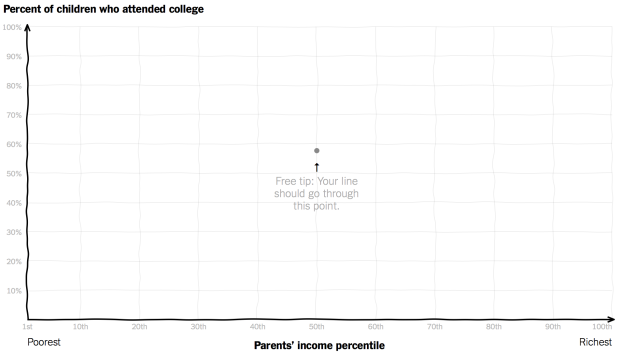
Those who grow up in poorer families are less likely to go to college, and those who grow up in richer families are more likely. The question is: How much does the likelihood of college attendance increase as family income increases? Gregor Aisch, Amanda Cox, and Kevin Quealy for the Upshot ask you this question. Draw a curve on a blank chart, and then compare your guess to reality and other readers’ guesses.
This is great.
From a technical point of view, the interaction is straightforward for readers, and with simple cues as you draw, it’s clear how to complete the task. Nice.
More interesting to me though is the challenge to readers to think about the relationship between income and college attendance. That seems like a pretty advanced task for a wide audience. (Although I’m guessing Upshot readers are more accustomed to reading and using x-y plots than the average person. Update: Then again, it’s currently on the nytimes.com front page, so there’s that.) So there’s some teaching along the way, namely a handful of curve examples within the text.
But the key is the comparison after you draw a curve. You get short bullet points about how you did relative to other readers, and of course, a comparison against reality.
And well, here, just try it yourself.
 Visualize This: The FlowingData Guide to Design, Visualization, and Statistics (2nd Edition)