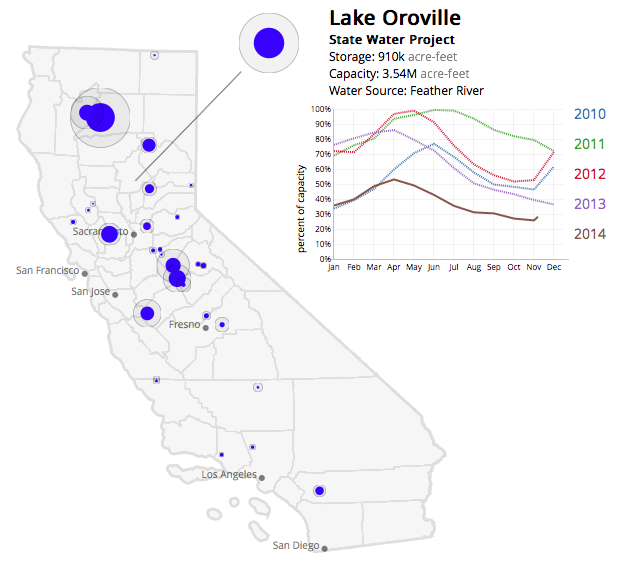
Winter is over and it’s shorts weather these days in California. This is good for relaxing outdoor lunches but not so good for the drought. It’s sad to drive down the state and see a bunch of barren farm land. Victor Powell shows this shift in water supply through reservoir data from the California Department of Water Resources.
Each dot represents a reservoir, and the outer circle around each dot is reservoir’s capacity. A time series chart appears when you select a reservoir so you can see the percentage of fill on a monthly basis. However, instead of showing the full time series with a single line, a line is drawn for each year so that (1) you can see seasonality and (2) overall fill percentage dropping.
 Visualize This: The FlowingData Guide to Design, Visualization, and Statistics (2nd Edition)