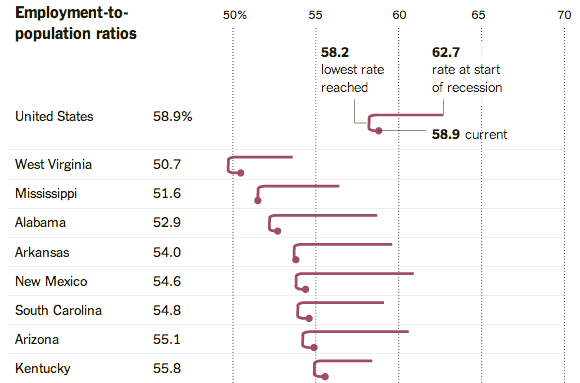
The Upshot posted an interesting chart that shows changing employment rate by state.
It shows that the economy is improving. Employment rates have climbed above the post-recession nadir in every state, although the improvements are often quite small. In Mississippi, the employment rate is just 0.1 percent above its recent low.
It also shows that the recovery has a long way to go. Employment rates have rebounded in some states with strong growth, like Utah, Nebraska and Montana. But only three states — Maine, Texas and Utah — have retraced more than half their losses.
You usually see this data presented as a time series chart, but this graphic focuses on three points of interest: employment rate at the start of the recession, the lowest rate, and the current. The rate is presented on the horizontal axis, so you see a cane-like shape that represents how far each state fell and how much farther they have to go.
I like this one. See the full graphic here.
 Visualize This: The FlowingData Guide to Design, Visualization, and Statistics (2nd Edition)