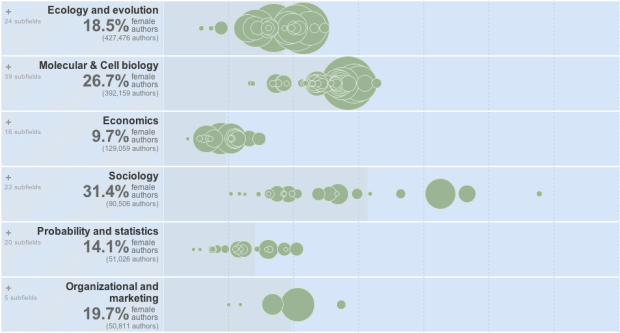
The Chronicle of Higher Education has a look at the percentage of academic papers published by women, over the past five centuries.
The articles and authors described in this data were drawn from the corpus of JSTOR, a digital archive of scholarly papers, by researchers at the Eigenfactor Project at the University of Washington. About two million articles, representing 1765 fields and sub-fields, were examined, spanning a period from 1665 to 2011. The data are presented here for three time periods, the latest one ending in 2010, and a view that combines all periods.
Percentage of female authors is on the horizontal, and each bubble is a subfield sized by total number of authors. The graphic starts with publishing for all years, but be sure to click on the tabs for each time span to see changes.
The data is based on the archive of about two million articles from JSTOR, and a hierarchical map equation method is used to determine subfields.
The gender classification they used for names seems like it could be nifty for some applications. Gender is inferred by comparing names against the ones kept by the U.S. Social Security Administration, which includes gender. If a name was used for female at least 95 percent of the time, it was classified as a female name, and the same was done with male. Anything ambiguous was not included in the study.


I wonder how the increasing prevalence of gender-ambiguous names may have affected trends? The gender split of babies so named isn’t particularly likely to be 50-50.