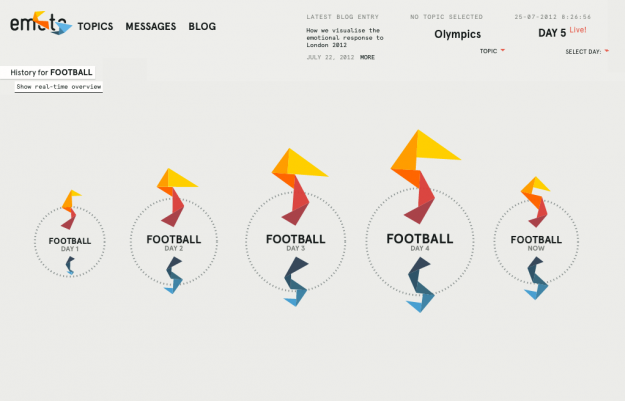
No doubt there is going to be a lot of tweeting about the Olympics during the next couple of weeks, but sometimes it’s hard to get a sense of what people are talking about because of the high volume. Emoto, a team effort by Drew Hemment, Moritz Stefaner, and Studio NAND, is a Twitter tracker that aggregates sentiment around topics.
We search twitter for general terms related to the Olympics. Within these search results, we look for individual topics, like athletes, disciplines, venues, or also general topics like “traffic” or “suprise”. Then, the text of each tweet is analysed for emotional words using the lexalytics software, resulting in a sentiment score ranging from -6 (very negative) over 0 (neutral) to 6 (very positive). As this project is about mapping emotions, our visualisation uses only tweets which can be assigned a sentiment value.
In line with the London 2012 logo, Emoto pieces together triangles to show this sentiment. The top yellow triangle indicates a very positive tweet, whereas a dark blue triangle far to the bottom indicates a very negative tweet. The triangles in between indicate sentiment scores in the middle, and the triangles are sized by the number of tweets that day.
There’s a view that lets you passively watch tweets as they come in live, which will be fun to see when something significant happens, but it’ll probably get most interesting when you can compare over time.

I’m sure there’s some skepticism about the triangles over everyone’s favorite bar graphs, but there’s so much fuzziness in tweet sentiment analysis that I don’t think it matters that much.


