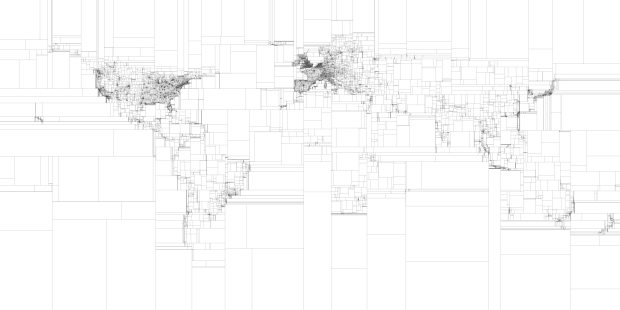
Eric Fischer, who continues his string of mapping fun and doesn’t even do it for his day job, maps the world in binary subdivisions. Each bounding box contains an equal number of geotagged tweets.
The best part is that Fischer is actually doing some problem-solving, trying to figure something out, so it’s not just a pretty picture.
The actual motivation behind it, by the way, was to figure out an approximately optimal set of bounding boxes to query for in APIs like Picasa’s, where if you ask for the whole world, you only get a few, very recent, results, but if you query for small enough bounding boxes, you can see further back in time. The idea is to choose bounding boxes with equal frequency so you get approximately the same time period of results from each of them.
Here’s the image zoomed in on the United States. As you’d expect, the concentration of boxes looks a lot like population density:

As does the view of Europe:

More maps from Fischer here.
 Visualize This: The FlowingData Guide to Design, Visualization, and Statistics (2nd Edition)
lovely! Those boxes are crying out to be colored in.
How many tweets does each box represent?