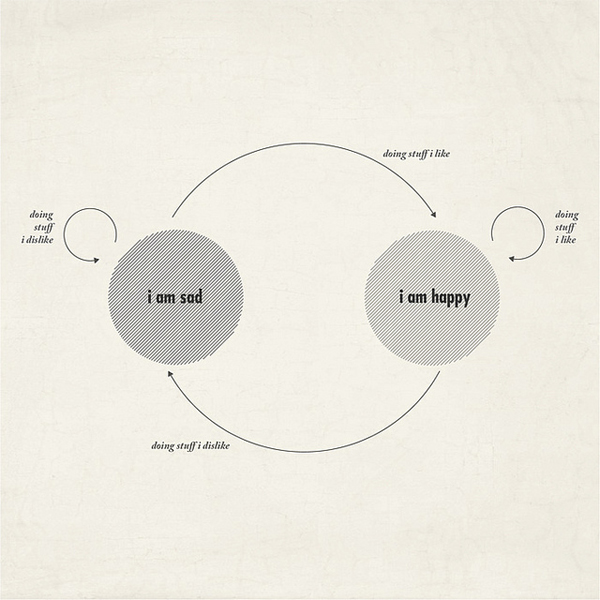
Along the same lines of the happiness flowchart, this graphic by Moritz Resl shows a simplified life cycle between happy and sad. Let’s not forget though that sometimes doing stuff you like leads to sad, and more importantly, doing stuff you don’t like can lead to happy. Have a nice weekend!
[Moritz Resl via swissmiss]


These figures are called state diagrams and are used when programming in embedded systems.
http://en.wikipedia.org/wiki/State_diagram
I know about state diagrams all too well. ‘Flowchart’ refers to what is linked.
The pursuit of happiness (don’t question it):
~
( I am happy ) —> Asking am I *really* that happy? —-> ( I am sad )
~
Therefore: “Asking am I *really* that happy?” = Doing stuff I dislike.
Pingback: The Happiness Life cycle « Simon Vreeman Shares
If only it were upside down, it kinda looks like a happy/sad face. Unfortunately the happy face is made up of the trigger “doing stuff I dislike”…
Pingback: The Happiness Life cycle « « Simon Shares Simon Shares