Guides
Tips and suggestions for working with and designing with data.
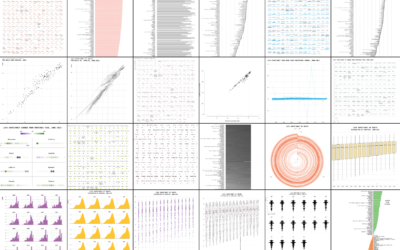
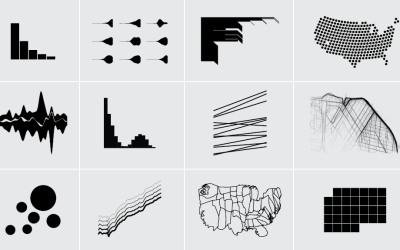
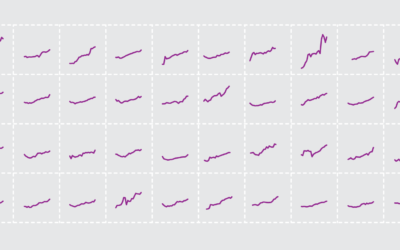
One Dataset, Visualized 25 Ways
"Let the data speak" they say. But what happens when the data rambles on and on?
Resources to Find the Data You Need, 2016 Edition
This is an update to the guide I wrote in 2009, which as it turns out, is now mostly outdated. So, 2016. Here we go.
Learning R Versus d3.js for Visualization
For those who work with R and d3.js, the differences between the two…
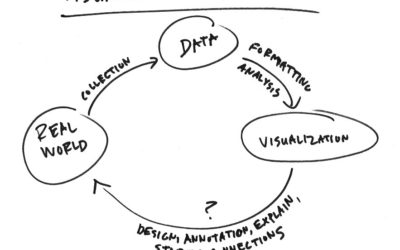
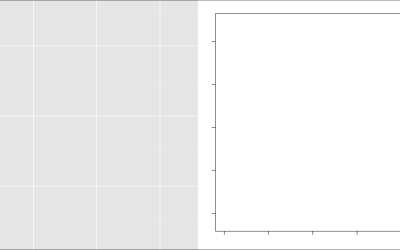
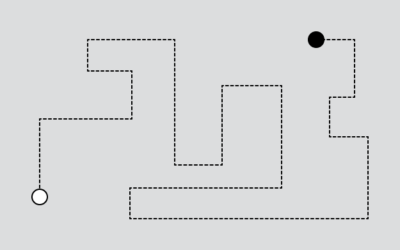
Shorten the Visualization Path Back to Reality
Visualization is complex, but if I were to break it down simply, I’d…
5 Tips for Learning to Code for Visualization
Here are some tips to get you started, based on my own experiences with R, and more recently, the JavaScript library d3.js.
What I Use to Visualize Data
“What tool should I learn? ” I hesitate to answer, because I use what works best for me, which isn't necessarily the best for someone else or the “best” overall. Nevertheless, here's my toolset.
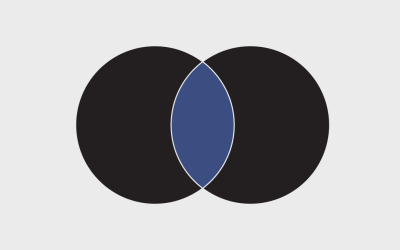
Venn Diagrams: Read and Use Them the Right Way
Venn diagrams seem straightforward, but why all the mistakes? Here's a guide to avoid the snafus.
Bar Chart Baselines Start at Zero
There are visualization rules and there are visualization suggestions. Most are suggestions. The ones that are rules exist because of how our brains process visual information. There's just no getting around it.
Real Chart Rules to Follow
There are rules—usually for specific chart types meant to be read in a specific way—that you shouldn't break. When they are, everyone loses. This is that small handful.
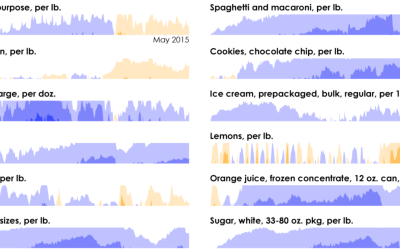
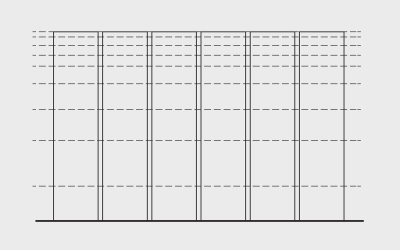
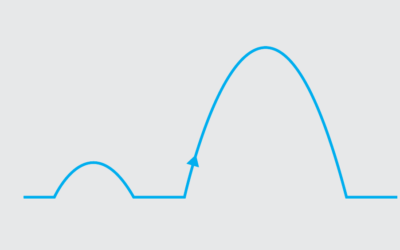
Horizon Graphs, with a Food Pricing Example
The rarely used chart type for time series data is actually quite nice, once you get the hang of it. Although it does have its limitations.
How to Make Government Data Sites Better
Accessing government data from the source is frustrating. If you’ve done it, or…
Getting started with visualization after getting started with visualization
Here's where to go next once you've covered the basics of visualization. When it's time to actually start making things.
Flexible data
Data is an abstraction of something that happened in the real world. How…
A Survival Guide to Starting and Finishing a PhD
Tips on making it through, what I would tell my previous self going in, and advice on taking advantage of the unique opportunity that is graduate school.