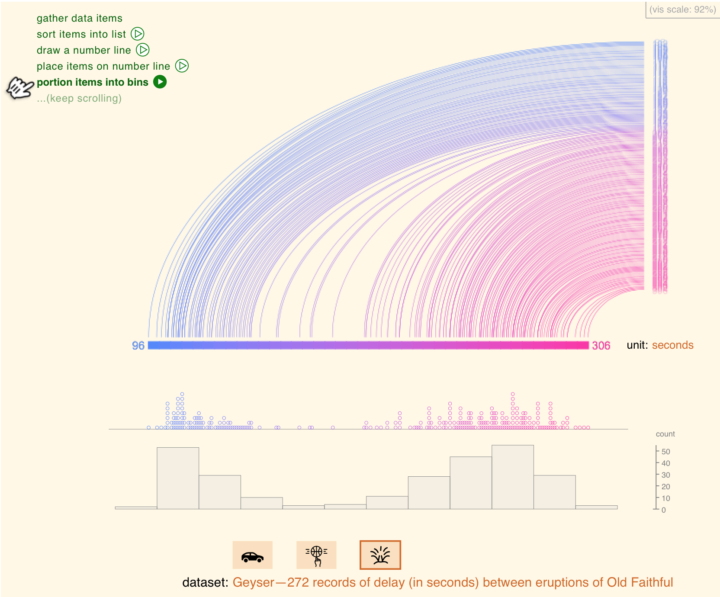
Histograms require some statistical knowledge to grasp, and without the tidbits, the distribution chart looks like any other bar chart. So much more though. They can show a lot about your data, and statisticians start nearly every analysis with at least one. Aran Lunzer and Amelia McNamara provide a visual essay to explain how they work, so that you too can reap the rewards.
An interactive to explain histograms, for normal people
Second Edition
 Visualize This: The FlowingData Guide to Design, Visualization, and Statistics (2nd Edition)
 Visualize This: The FlowingData Guide to Design, Visualization, and Statistics (2nd Edition)
New tools, refined process.