The collaborative project Phototrails is a visual exploration of millions of Instagram photos, building on previous work with ImagePlot, which lets you see a lot of photos at once.
How do we explore social medias visual data which contains billions of photographs shared by hundreds of millions of contributors? What insights can we gain from this type of massive collective visual production?
Phototrails is a research project that uses experimental media visualization techniques for exploring visual patterns, dynamics and structures of planetry-scale user-generated shared photos. Using a sample of 2.3 million Instagram photos from 13 cities around the world, we show how temporal changes in number of shared photos, their locations, and visual characteristics can uncover social, cultural and political insights about people’s activity around the world.
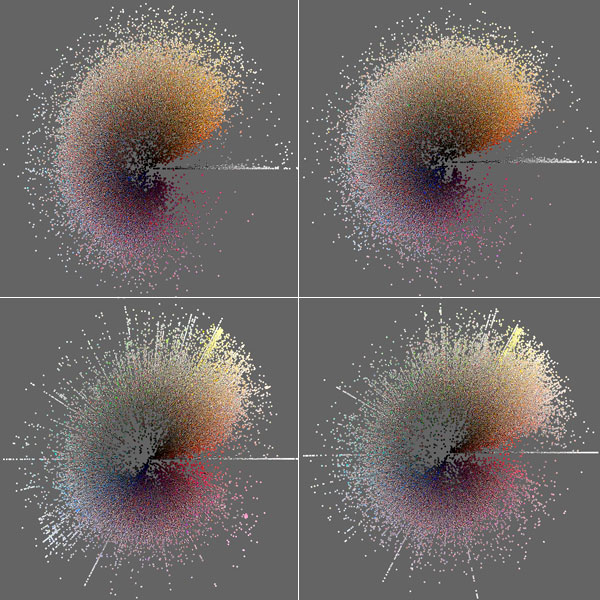
The charts above, starting from the top left and moving clockwise, are a sample of 50,000 Instagram photos each from San Francisco, Tokyo, Bangkok, and New York City, organized by hue and brightness.
The bottom two look a lot brighter than the top two, but I suspect that’s because hue median is used for the former and hue mean for the latter. That’s probably also why you see more distinct lines on the bottom, especially towards the edges, whereas the top spectrum is more continuous. Then you have a nice sudden break in color for the black and white photos.
 Visualize This: The FlowingData Guide to Design, Visualization, and Statistics (2nd Edition)