When we make charts and graphs, we usually think of the data abstractions in terms of bars, dots, and other geometric shapes. ImagePlot, from UCSD-based Software Studies, instead makes it easier to use images to understand large collections.
Existing visualization tools show data as points, lines, and bars. ImagePlot’s visualizations shows the actual images in your collection. The images can be scaled to any size and organized in any order – according to their dates, content, visual characteristics, etc. Because digital video is just a set of individual still images, you can also use ImagePlot to explore patterns in films, animations, video games, and any other moving image data.
You can do this with other software (like R, for example), but ImagePlot is specifically built to handle lots of images (in the millions) and so it is much more robust, and it’s GUI-based, so no programming is required to use the software, which works on Windows, OS X, and Linux. The interface is pretty basic and not totally clear at first, but play around with the sample datasets and you should be able to pick it up fairly quickly.
Here’s a zoomed out view of Time Magazine covers:

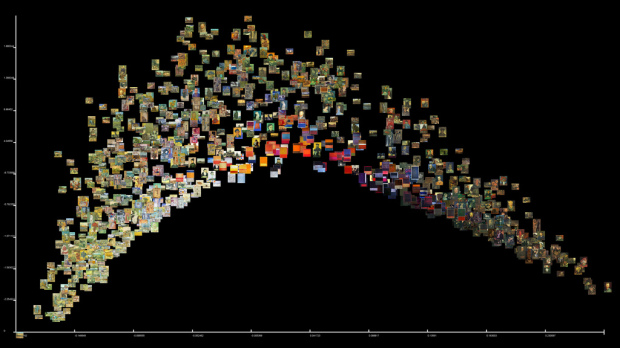
These are Van Gogh paintings organized by month/year on the horizontal and color on the vertical:

So you can see there’s quite a bit of flexibility with the program, which could lead to some fun if you have a large image dataset. Save your results as a high-resolution image or even in animation form.
You can download ImagePlot here, and for more ideas for what you can do with it, check out the Flickr stream.
 Visualize This: The FlowingData Guide to Design, Visualization, and Statistics (2nd Edition)
ImagePlot documentation includes detailed tutorials which explain how to use program’s interface.
Indeed, interface is somewhat basic because ImagePlot is a macro running inside ImageJ open source software which limits what we can do in terms of design.
However, by being able to utilize existing ImageJ code which is widely used in sciences (from astronomy to biology), we can keep our program very small (68 K) and also take advantage of imageJ best in the industry image processing speeds.
We also supply a few additional macros we wrote in ImageJ which report size and proportions of all images in your collections, and also measure their visual properties (brightness, saturation, hue, shapes.)
This is very cool. The examples are interesting, but I think where it might really play is less with things like magazine covers, and more where you can plot things like morphology of species perhaps based on genetic variances. It would definitely call out the visual aspect so much more. The Van Gogh example does that to some extent with how his style changed over time, and chosen palette (darker to lighter).
Very cool indeed Lev. Looking forward to visualizing Neolithic arrowheads , Tom