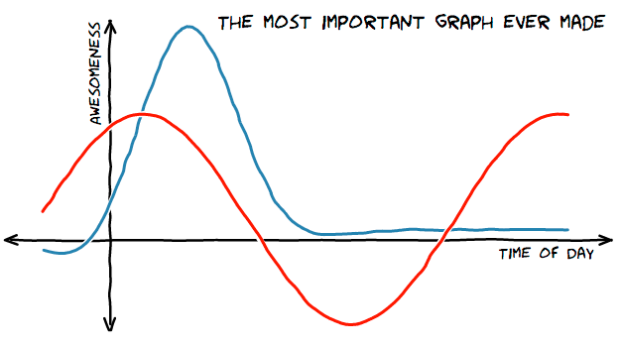
The ports and packages to make your charts look like they came from the web comic xkcd are coming out in rapid fashion. Dan Foreman-Mackey stylized charts in JavaScript using D3, Mark Bulling did the same in R (dead/spam link), Emilio Torres Manzanera made an xkcd package, and Jake Vanderplas described how he did in Python. Still waiting for a Gangnam theme.
xkcd-style charts in R, JavaScript, and Python


 Visualize This: The FlowingData Guide to Design, Visualization, and Statistics (2nd Edition)

Liam Revell has also produced code to make xkcd-style evolutionary trees in R, which is wicked awesome! –
http://phytools.blogspot.com/2012/10/bug-fix-in-xkcdtree-xkcd-caribbean.html
Mathematica also! See http://blog.wolfram.com/2012/10/05/automating-xkcd-diagrams-transforming-serious-to-funny/
:)
This was just presented at Visweek and uses Processing to make “sketchy” charts: http://gicentre.org/handy/
And LaTex: http://tex.stackexchange.com/questions/74878/create-xkcd-style-diagram-in-tex
All this started from a question posted at Mathematica Stackexchange site. They got some very nice programming solutions and inspired other programming communities to do the same.
http://mathematica.stackexchange.com/questions/11350/xkcd-style-graphs
am I not seeing it or does this graph not have a legend??
The matlab crowd on Stackoverflow also took a stab at this: http://stackoverflow.com/questions/12701841/xkcd-style-graphs-in-matlab and one guy put his source on github: https://github.com/slayton/matlab-xkcdify