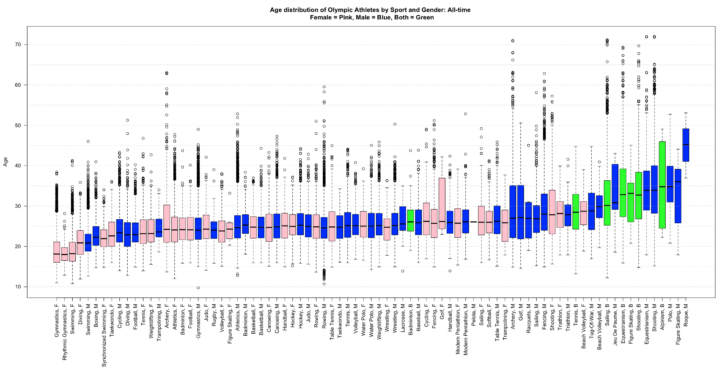
Last week, the Washington Post compared the ages of Olympians, but it only focused on range, so you couldn’t see the variation in between. For example, Dara Torres was 41 at her last Olympics so the bar was stretched to the right even though there were no other swimmers near that age. Plus the Post piece was US-only. So Gregory Matthews took the statistician’s route and box plotted the age of all olympians from all countries.
This barebones layout of course sacrifices the relatability of the first, but it’s easier to see the distributions of each sport and to spot the outliers. Apparently there was an 11-year-old swimmer Yip Tsz Wa at the 2004 games in Athens. Wha?


 Visualize This: The FlowingData Guide to Design, Visualization, and Statistics (2nd Edition)

I have a crick in my neck after looking at this chart. Would it have been impossible to rotate it 90 degrees clockwise?
I apologize for you neck ailment; I never meant to injure anyone with my box plots. I’ve rotated it 90 degrees here: bit.ly/LWJf5b