Yesterday I visited the ever popular NYU ITP bi-annual show which is a showcase of the students’ experimental and ingenious interactive work.
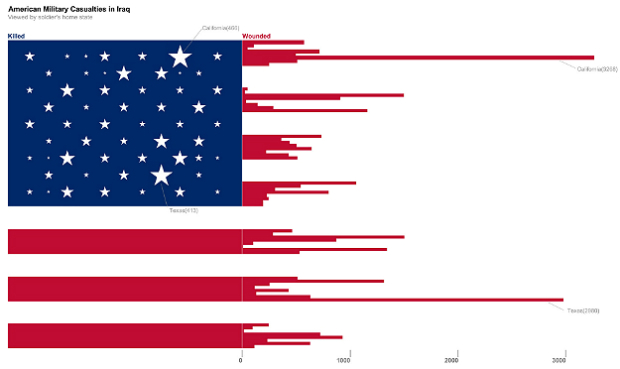
I stopped to talk to data visualization student and self-tracker, Doug Kanter, about his work. His first and smaller piece was about the war in Iraq. The image above depicts the number of wounded US soldiers by state (and territory) using the red stripes. The stars show the number of soldiers killed. I’m sure we could quibble about labels and where the bar chart starts, but to me, the tattered appearance of the flag created by data about war is very arresting.
Doug’s more developed work dealt with his self-tracked health data. He’s a type-1 diabetic and monitors his blood glucose, insulin dosage, and diet among other things. His visualization showed three months worth of data by which he says he was able to see how a low-carb diet helped keep his blood sugar in check. Doug’s blog post detailing his process and visualization is worth a read.
The ITP Spring Show runs through this evening at 721 Broadway in NYC. Over 100 projects are on display making this a must see of interactive innovation.
 Visualize This: The FlowingData Guide to Design, Visualization, and Statistics (2nd Edition)
Wow! The personal insulin project is amazing. I’m not sure the final chart is the one I would have chosen, but I really learned from seeing and reading the evolution of his thinking about the data, the message, and different ways of trying to communicate it. Cheers to Mr. Kanter’s endeavors.
For anyone struggling to figure out what “ITP” is from this article and the links provided, it’s the Interactive Telecommunications Program at New York University’s Tisch School of the Arts (http://en.wikipedia.org/wiki/Tisch_School_of_the_Arts#Interactive_Telecommunications_Program). Seems to be about creating innovations in new media.
Great program.
Thanks for posting that, Al. It’s very similar to MIT Media Lab (with which more folks are familiar).
I was there yesterday, too! The number of students with novel and creative ideas stunned me. Especially those that dealt with data visualization (a significant portion). The sex toys made from Republican presidential nominee approval ratings, the UN well-being visualizations and books, the music playing swing, all the data sculptures, etc…
I loved the data sculptures. Unfortunately, the photos I took of them aren’t very good and they don’t have much info online about them, so I didn’t do a blog post about them. The Pennsylvania wind farm was my favorite. I didn’t have time to try the swing (I had to catch a train), but it looked fascinating. I may post about a couple of the dataviz web pieces at the show.