Perpetual Ocean

Mar 27, 2012

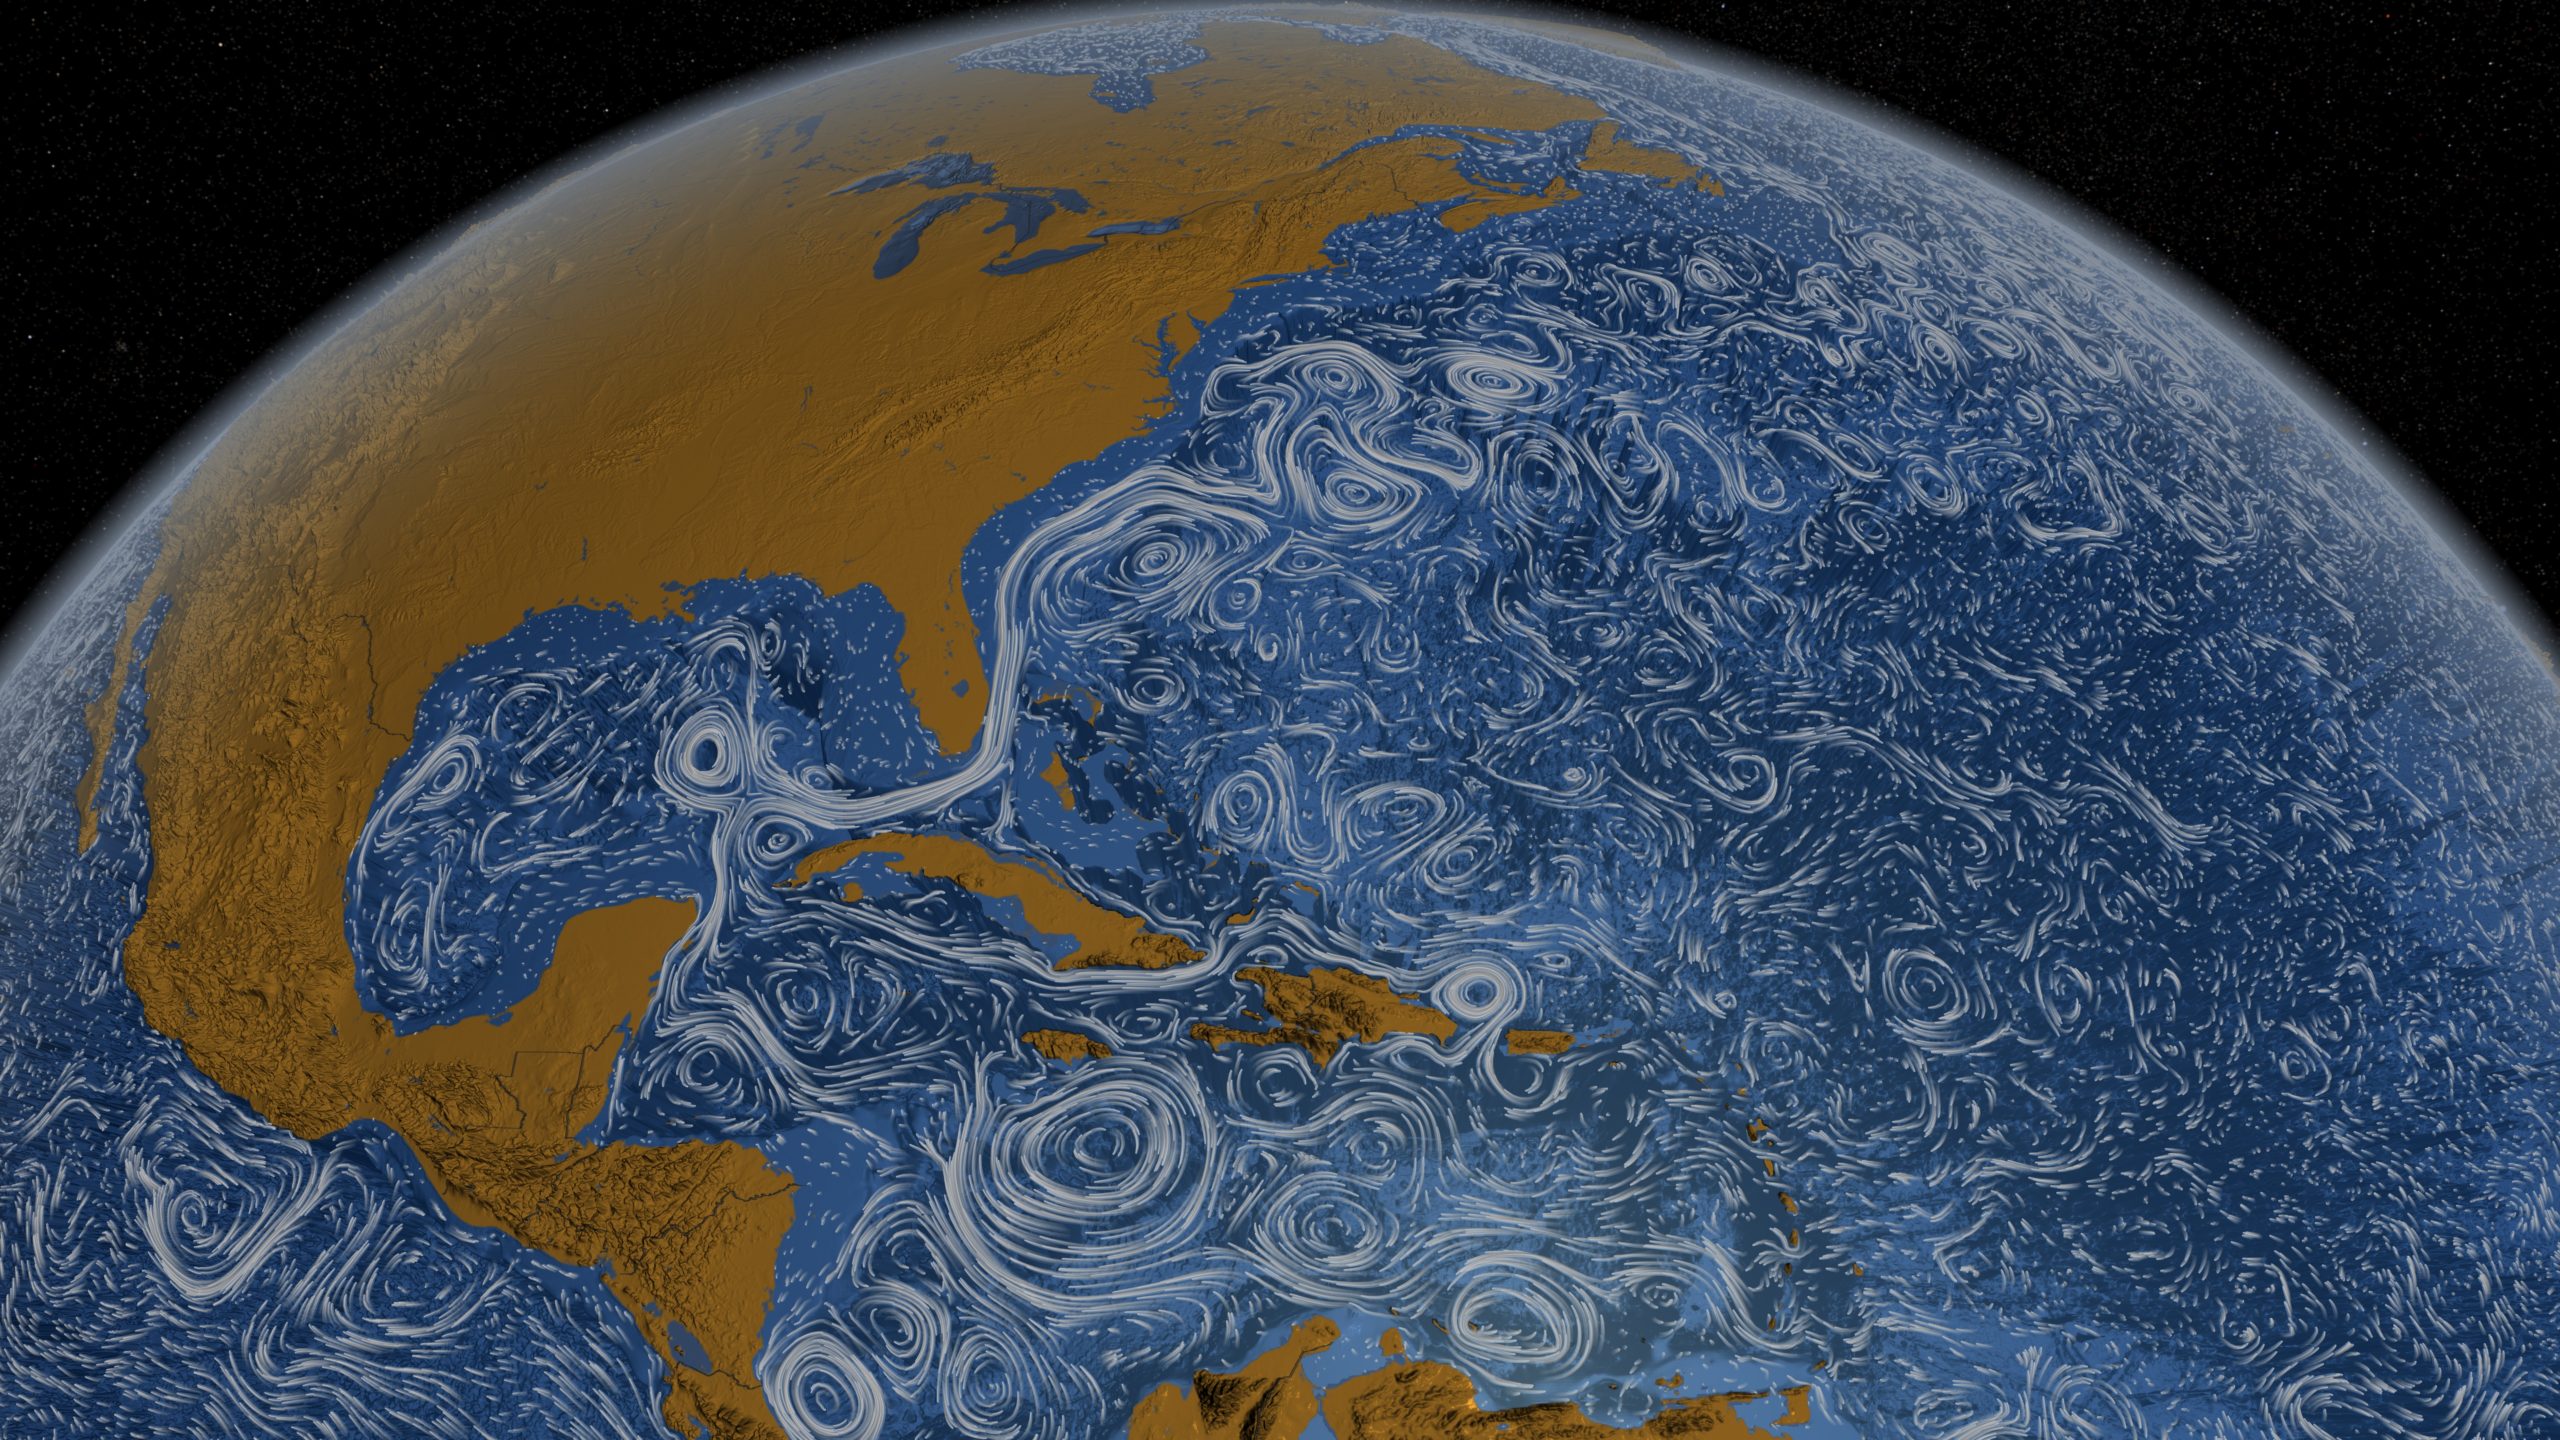
Using a computational model called Estimating the Circulation and Climate of the Ocean, Phase II (ECCO2), the NASA Goddard Space Flight Center Scientific Visualization Studio (I think NASA has a thing for long names.) visualizes surface currents around the world. This is beautiful science here. Make sure you turn on high-def and go full screen. [via @aaronkoblin]

Become a member. Support an independent site. Make great charts.

See What You Get
Favorites

Interactive: When Do Americans Leave For Work?

We don’t all start our work days at the same time, despite what morning rush hour might have you think.

Pizza Place Geography

Most of the major pizza chains are within a 5-mile …

10 Best Data Visualization Projects of 2017

It was a rough year, which brought about a lot of good work. Here are my favorite data visualization projects of the year.

Famous Movie Quotes as Charts

In celebration of their 100-year anniversary, the American Film Institute …