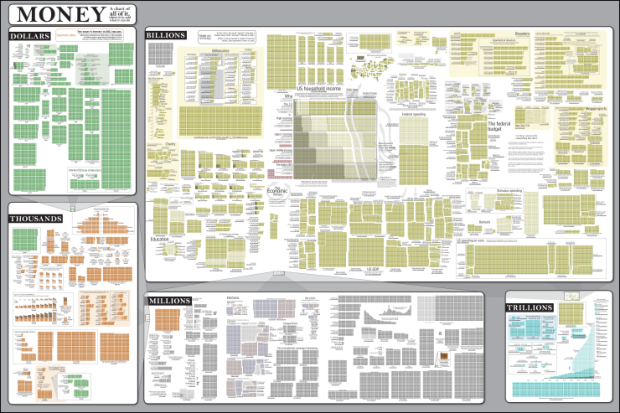
Randall Munroe of xkcd charts the things that money pays for, from the item off the dollar menu all the way up to the total estimated economic productivity of the human race. Following the same scheme to show relative scales that he used for his radiation chart, you get a big picture, a zoom for another big picture, and so on.
For example, here’s the transition from millions to thousands of dollars:

See the graphic in its mondo format here, and see the list of over 200 sources here. So simple, but executed with rigor.
[xkcd]
 Visualize This: The FlowingData Guide to Design, Visualization, and Statistics (2nd Edition)
Cool visualization
Saw it this morning and found it extremely confusing. I like the idea a lot I find it difficult to get a real feeling of scale from it. It’s also hard to read because the data is not sorted in a lineal way, my eye keeps jumping from thing to thing.
It’s not cool. It’s a masterpiece. The difficulty was to render a very huge quantity of information on a single graphic.
Squares are one of the simplest symbolization that exist and it helps understand scale. Despite the repetitive square figure, he managed to make this graphic not monotone by playing with the squares in different manners: bar graphs, sort of line chart, tree map, even geographic map.
Within each category, he managed to arrange sub-graphics by topic. We can compare the costs of a millon category item with a thousand category item and wonder if the difference seems justified, and compare items inside oen, category too: example of domestic animal ownership
The fractal dimension of the representation makes it really esthetic, profound and easy to read (accessible to everyone). Moreover, as fractals are the basis of nature, it can question the society about the links between nature and economics. It makes it sort of universal.
Pure xkcd. If you get it, or have the patience to figure it out, it’s brilliant. And it couldn’t care less whether you get it or not.
I find myself wishing I could blow it up, hang it on a big wall, and study it for a few days. xkcd can be exceptionally insightful and hilarious — I bet there are many gems hidden in this graphic.
https://store.xkcd.com/xkcd/#MoneyPoster
Really nice. I was actually thinking on playing a bit with this concept… what would be the best way to do something like that? R? Python and SVG? Any hints?
Initial impact is cool, then you look at the details and realize it’s full of errors.
I went to xkcd’s web site to report a few of these, and there are literally pages of comments documenting the mistakes. These are not differences of opinion, the are hard, factual errors. (Mis-labeled corporations, wrong numbers, wrong number of boxes (or shading).
Nice first attempt, but I’d wait for “revision 2” before I shell out $15 for the printed poster.