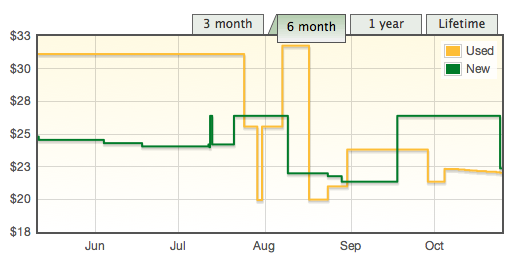
It’s been about three months since Visualize This came out, and in case you haven’t gotten your hands on a copy yet, now might be a good time to get it. Amazon just lowered the price.
I didn’t know price changed so much — although I’m not surprised — I’m guessing based on a number of factors such as third-party prices, competitors’ prices, and sales. The Kindle version (not shown) changed a lot in the beginning, costing more than the paperback, but I don’t think it’s changed since it came down to the current price. You can see the changes, as reported by price tracking site Tracktor (just try to ignore the weird vertical scale).

The used price is not completely accurate since there weren’t any used copies available before the book was released in July.
Also, I’m not entirely sure about the listings for used books on Amazon, as all of them are from resellers with thousands of ratings. Four copies are listed for above retail, and one of those is more than four times as much. That expensive copy must be a special edition that I haven’t heard about.

 Visualize This: The FlowingData Guide to Design, Visualization, and Statistics (2nd Edition)

I wouldn’t be surprised if the above-retail and available-at-launch used copies aren’t some sort of automated price scalping deal.
Write a script to make listings when a new book is released at above retail–if a purchase is made, buy direct from amazon and ship to customer (or ship to warehouse and then reship to customer).
There might be someone who stupidly buys it blindly thinking used books are cheaper or there might be a price/inventory blip on amazon’s part that makes the used copy a better buy (at which point they wait for the blip to be corrected before ordering and shipping).
Probably not a profitable strategy if you have to do it by hand…but if you could have it done automatically you would probably pick up a few bucks here and there from idiots.
That makes sense. I also just noticed that many of the sellers of new copies are also the same sellers in the used section.
Algorithmic price setting sometimes leads to weird behaviour.. e.g. the $23M book about flies: http://www.michaeleisen.org/blog/?p=358
What’s the deal with the vertical axis (2, 3, repeat)??
Yeah, no clue. Not my doing.
The vertical axis is probably set to move in $2.50 increments, but uses no decimal point for values so every $.50 is rounded up to make the appearence of $3 increments : -)
Wait. There are USED copies available? Clearly that must be an error. :)