If you’re a parent, most likely you want your children to go to the best schools available, but what if you found out that the school that they attend didn’t measure up to the school a couple miles away? Using previously unreleased federal education data, ProPublica helps you compare.
ProPublica analyzed new data from the U.S. Department of Education Office of Civil Rights along with other federal education data to examine whether states provide students equal access to programs — such as Advanced Placement or higher-level math and sciences classes — that researchers say will help them later in life. We found that in some states, high-poverty schools are less likely than wealthier schools to have students enrolled those programs.
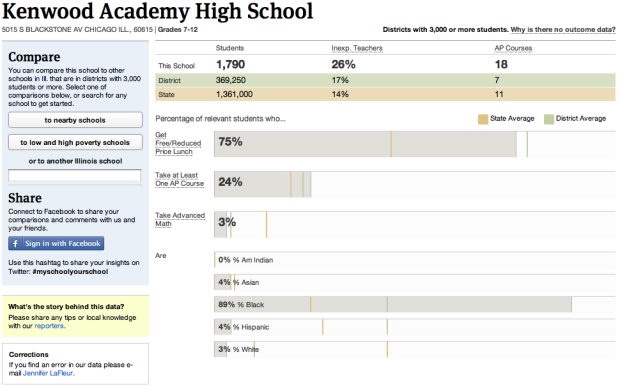
Enter an address or school name and get some quick numbers about your school or ones near by such as percent of new teachers, school size, and percentage of students taking at least one AP course (shown above).
Then hit compare to see how your school measures up against the rest.

What does your childhood or child’s school look like? Do the numbers match your perception?
[The Opportunity Gap via @pilhofer]
 Visualize This: The FlowingData Guide to Design, Visualization, and Statistics (2nd Edition)
I am a little perplexed by the data… this is my school – http://projects.propublica.org/schools/schools/421899000923
All of our students take Geometry – which by their explanation would be advanced math, but our number for advanced math is 23%, and even if you exclude the freshmen from the data (who don’t all take geometry yet), the number should still be above 75% . Our Free and Reduced number according to our district webpage – https://webapps.philasd.org/school_profile/view/2650 – is 49.1%, but ProPublica has it at 22%. In addition, our school offers no AP courses. If students take the courses, it is on their own time outside our school day. Our students do take the courses but to say tat our school offers them is incorrect. I also question their inexperienced teacher index – feels like it might be 1st or 2nd year at the school, but not in teaching…
Now I know that I can fill out a form and let them know that their data is off, but my question is… how reliable is the data if they are just straight up wrong on multiple categories. In all fairness we are a new school and I’m sure it is related to the inaccuracies. Still, the number of inaccuracies are troubling.
In addition, I question the use of AP enrollment as the measure of a good school. I could spend a ton of time on this… rote memorization of information to be kicked out on a test… is not the type of learning we should be running towards right now, imo.
The next step in this type of analysis will need to measure the transformation of high school students to higher level of education. I have started a field research on the field. However, I need more support. http://visualalpha.com/111/services/user-analysis/user-analysis-post-1/
Pingback: Tweets vs. Likes: What gets shared on Twitter vs. Facebook? « Edwin Chen's Blog