As we know, browsers keep getting better, and it grows easier every day to visualize data native in the browser, when you used to have to use Flash. In the early goings, the JavaScript visualization libraries felt clunky to their Flash counterparts, but the roles are changing. There’s Protovis, Polymaps, and Processing.js that help you make full use of modern browsers’ functionality.
Mike Bostock, who had a big hand in those first two, recently made Data-Driven Documents, or D3 for short, available to play with.
To be clear, D3 isn’t Protovis 2.0. D3 is a completely different library (although they do share a similar approach, code-wise).
Where D3 and Protovis differ is the type of visualizations they enable (the what), and the method of implementation (the how). While Protovis excels at concise, declarative representations of static scenes, D3 focuses on efficient transformations: scene changes. This makes animation, interaction, complex and dynamic visualizations much easier to implement in D3. Also, by adopting the browser’s native representation (HTML & SVG), D3 better integrates with other web technologies, such as CSS3 and developer tools. Our hope is that this makes D3 not only more powerful, but easier to use.
Another way to put it is D3 sits closer to the browser, and you’re directly manipulating SVG documents. Protovis on the other hand also manipulates SVG documents, but a lot of that is done behind the scenes when you call functions. The advantage of the latter is that, well, you don’t have to deal directly with the SVG, but you lose some flexibility. D3 lets you kinda do what you want.
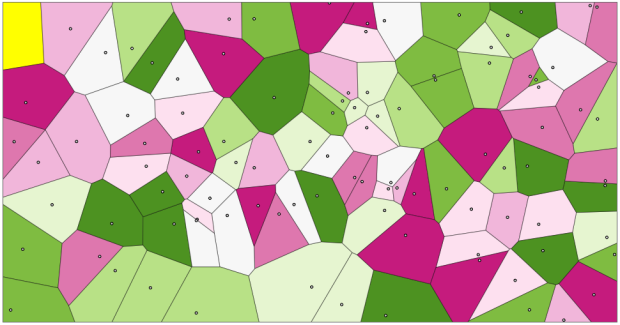
For a taste of what you can do, there is a nice examples gallery. Above is a Voronoi diagram. Below is a scatterplot matrix, chord diagram, and streamgraph, respectively. They’re all interactive.


While D3 is still in its infancy, it’s obvious that it’s a visualization library to keep an eye on. If there are any Protovis users out there who have gotten their hands dirty with D3, I’d love to hear your first impressions.
[Data-Driven Documents | Thanks, Mike]
 Visualize This: The FlowingData Guide to Design, Visualization, and Statistics (2nd Edition)
Go to the Wolfram Demonstrations Project Page
http://demonstrations.wolfram.com/topics.html
and you can see these ideas fully implemented already.
Cool, but sort of off point. D3 is interesting because you can do all of these things native in the browser, in JavaScript, and it can all be done custom. The Wolfram CDF player on the other hand is a desktop tool.
I just ported a simple time series area graph from Protovis to D3. Wasn’t too difficult. The D3 version is a bit more verbose; there are no helper methods for things like “draw a line from x1,y1 to x2,y2”, so it’s 50 characters of code instead of 20. But it’s not too bad and the benefit is you have very direct understanding and control over the layout. And you can do anything SVG can do, easily, which is a lot of power.
The straight port of the graph looked identical; no surprise. The benefit is with the D3 version I could then easily add interaction, various exploratory features like a cursor that showed textual data on mouseover. It’s awkward doing that in Protovis and seems to require re-rendering the scene graph; with D3 it’s easy to update and modify the document as opposed to redraw it.
I’ve been using d3 for an ecological monitoring data project. I really like the fact that it looks like normal javascript compared to protovis, and animation is indeed a lot easier. Being able to integrate better with CSS is also a major plus.
I’m about to embark on a new visualization using d3 where I expect I’ll actually just use normal html and css rather than SVG for bar graphs. This is another cool possibility opened up by the way d3 works.