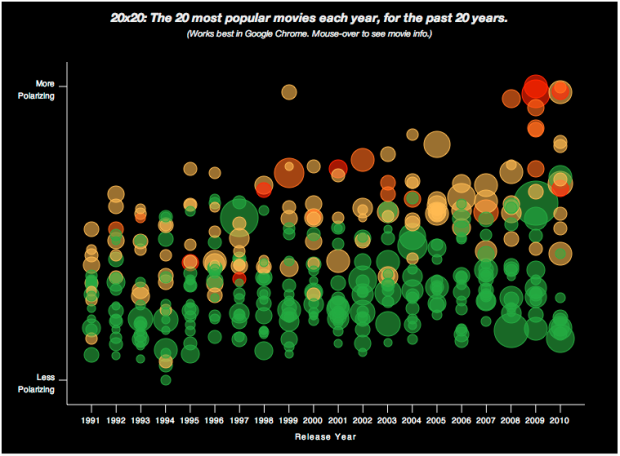
Moki takes a page out of the OkCupid social media playbook and analyzes movie ratings over the past two decades. They looked at the 20 most popular movies for each year, and then plotted them by “polarization,” or rather, standard deviation, or in other words, movies that had a wider spread of ratings were more polarizing than those where reviewers came to a consensus.
Here’s their reasoning:
The key, we think, is to look for movies that some love and some hate, which is the likely profile of a bad movie that’s “safely” manufactured for an existing fanbase. In other words, movies that are polarizing.
Does that really make a movie bad though? My wife, a fan of the Twilight series, would disagree. Maybe what we’re seeing is not so much movies getting worse, but people who rate movies on Moki growing less neutral, because there was clearly plenty of suck in the 1990s and 2000s.
From the polarization perspective, however, the results are pretty clear. Opinions on sequels are almost always more divergent than the originals.
[Moki | Thanks, Dominic]
 Visualize This: The FlowingData Guide to Design, Visualization, and Statistics (2nd Edition)
One could just as easily draw the opposite conclusion. Movies that aren’t polarizing are the ones intended to appeal to the broadest demographic–white bread cinema.
I agree. The folks over at Threadless had something to say about polarizing T-shirt designs, the sell more shirts. They identified two types of successful designs: great designs that everyone liked which are rare, and controversial designs that nearly half of the people rated either 0 or 5 and are much less rare. I think it has to do with the notion of tribes.
Imho, The wider spread is also caused by the sheer quantity of people rating the movies, as opposed to the limited number in the earlier years. Internet, digital subscriptions, and a wider viewership (due to increase in overall poulation maybe? ) are another cause.
Still, nice visualization :)
Great work, fine visuals, but a silly conclusion. The idea that increased standard deviation means lower quality is a weird hypothesis. Especially since they are only looking at the top 20 grossing movies for each year, it seems any conclusion is only valid for the movies that gross the most. And their conclusion is self evident based on this: of course the movies that are targeted to the broadest base of moviegoers are the ones that are making a lot of money! So by design the top 20 will appear to be “manufactured for an existing fanbase” – the existing fanbase is why they are in the top 20!
But to conclude generally that high SD = bad movie is hard to defend. Here are the top ten movies with highest SD in the Netflix Prize dataset* :
The Royal Tenenbaums
Lost in Translation
Napoleon Dynamite
Pearl Harbor
Fahrenheit 9/11
Miss Congeniality
Sister Act
Kill Bill: Vol. 1
Anchorman: The Legend of Ron Burgundy
The Passion of the Christ
Less than half of these could be considered to be targeted to a broad base, the others are risky, quirky, indie movies willing to take a stand (artistic, political, or religious).
It is unclear is SD is increasing over the entire set of movies. If indeed it is,
I would argue that it is due to the availability of streaming movies, scores of cable movie channels, hulu, etc. more people have exposure to the smaller, challenging movies that often generate passionate feelings, positive or negative.
====
* see http://www.netflixprize.com/community/viewtopic.php?id=164 for more discussion of variance in the Netflix Prize
Pingback: Most Popular Movies Getting Worse (1991-2011) | The Big Picture
It could also be that there is a selection bias in the movies raters will rate. It’s less likely that raters will seek out movies from a decade or two ago in order to give them a bad rating, whereas they’ll actively seek out their favorites to give a high rating. Conversely, raters will tend to rate contemporaneous movies equally frequently, regardless of whether they are good or bad.
I’d imagine there are more REVIEWERS in the more recent years when compared to 20 years ago. That increase in “N” is going to mean greater opportunity for polarization (particularly if the newer reviewers aren’t exactly traditional reviewers). I’m not sure I agree with the analyst’s conclusion that sd=bad movie. I’d like to see more evidence to that assumption
Looks like Phantom Menace was the bellweather. That makes sense.
IDK. toy story 3 has a very low “polarized” rating and it’s the poster child of a fabricated movie for an existing fan base. I didn’t think it was very good either.
I agree with Nathan’s wife that strong disagreement on a movie’s quality doesn’t mean it’s bad.
Usually when people disagree on a movie it means there is something to be argued about.
what would be more interesting would be to focus on the relationship between “polarizing”, box office and budget (rather than whether the movie is good or not). in other words, since studios don’t care for art anyway, is it more profitable to disappoint a wide audience – high & large (indiana jones 4, transformers 2, new star wars) or to make sure to please a small group of loyal fans – small & low (kick ass, 500 days of summer etc.)
in any case I’d like to congratulate the authors for the design of the chart. (i didn’t know moochart, it’s worth a look. and nice jquery action too.) they had a point, they made very sensible design options to serve it.
Pingback: Movies Getting Worse | enosarris.com
I’d imagine there are more REVIEWERS in the more recent years when compared to 20 years ago. That increase in “N” is going to mean greater opportunity for polarization
Pingback: » Are Movies Getting Crappier, or Just More Expensive? » DragonFlyEye.Net