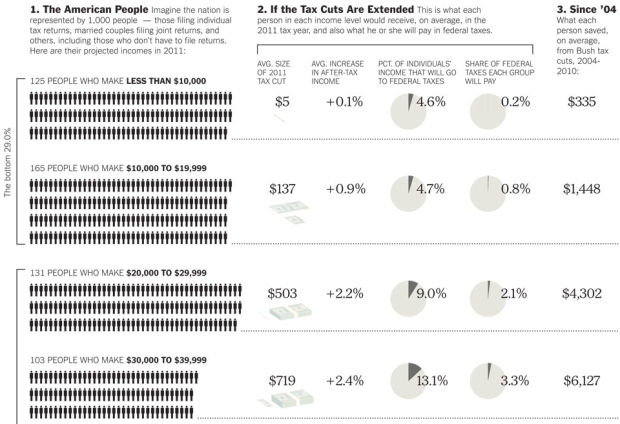
There are some major tax decisions to be made soon, and they’ll affect you differently, depending on what bracket you’re in. Bill Marsh of The New York Times takes a stab at showing the differences. The American population is put into context with a hypothetical population of 1,000. For example, if America was a population of 1,000 people, 125 of them would make less than $10,000. Piles of Benjamins shows average size of the 2011 tax cuts.
We saw the same tax topic explored by The Washington Post, except their’s was interactive and showed costs with Obama’s proposed plan. Which one works better? My vote is for NYT. It takes up a lot more space, but it’s much more straightforward and to the point.
 Visualize This: The FlowingData Guide to Design, Visualization, and Statistics (2nd Edition)
Probably done for screen real estate, but someone pointed out that since you’re only including the top four lines of the graphic, it makes Bush’s look a lot more reasonable than they should if you see the whole graphic on the NYTimes.
@JohnAllspaw Hopefully people click through to see the full graphic :)
I find it very misleading. The rates are handled at a household level, and this example distorts it by equating to individuals. Makes a big difference! This also shows only the “savings” and ignores the actual tax burden at the different levels. The savings look lopsided toward higher earners, but the tax burden is even *more* lopsided, since the lower incomes groups don’t pay taxes, but instead get credits, i.e., they are getting paid by the other taxpayers.
@markr Yes, the problem is that units for share of federal taxes are inconsistent with all other units. Share of federal taxes is shown “per group” and every thing else is shown “per person”.
Combined with the fact that the top group has only one person, it makes it very visually misleading.
I’m not sure if it was intentionally, but it sure fits with the bias the NYT is often accused of having.
A lot of people do not know the numbers. Charts like this — factual charts that is — should be distributed to people as information material.