In a collaboration between SimpleGeo, who makes location data easier to access, and Stamen, who does all kinds of wonderful with maps, announced Polymaps today. It’s a free and open-source JavaScript library for image- and vector-tiled maps using SVG.
Polymaps provides speedy display of multi-zoom datasets over maps, and supports a variety of visual presentations for tiled vector data, in addition to the usual cartography from OpenStreetMap, CloudMade, Bing, and other providers of image-based web maps.
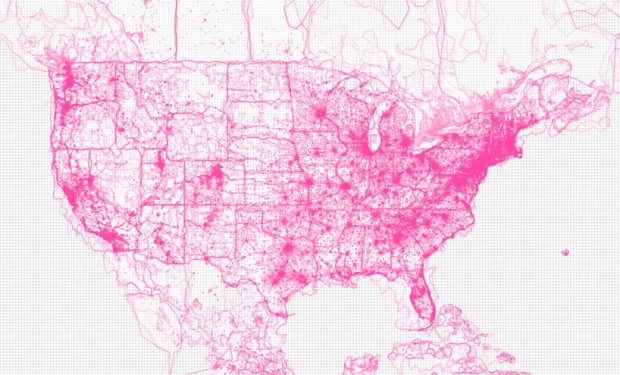
Because Polymaps can load data at a full range of scales, it’s ideal for showing information from country level on down to states, cities, neighborhoods, and individual streets. Because Polymaps uses SVG (Scalable Vector Graphics) to display information, you can use familiar, comfortable CSS rules to define the design of your data. And because Polymaps uses the well known spherical mercator tile format for its imagery and its data, publishing information is a snap.
The above is map using Flickr shapefiles. Here’s a map of pavement quality in San Francisco.

Here’s another showing unemployment.

As you interact with the maps, you’ll notice they feel very polished, and they work how you would expect. You can zoom in and out and pan in all directions with your mouse, or you can use your scroll wheel and keyboard arrows.
There are a few reasons why Polymaps is a big deal, but mainly, it makes online mapping so much easier and lets you do so much more than your standard marker maps. Also, it’s in JavaScript, so you don’t have to deal with compiling and many of the complexities that come with Flash and Actionscript. Plus it’s free and open-source.
This is customizable sexiness right here. I can’t wait to finish my dissertation, so I can really play with the library.
Check out more working examples and source code on the project page or download Polymaps on github and get started right away.
 Visualize This: The FlowingData Guide to Design, Visualization, and Statistics (2nd Edition)
Pingback: release often | Bookmarks
Yeah! SVG and JavaScript, together again.
Boo! The Mercator projection system was designed for mariners to navigate at sea in wooden boats during the 1500s. It should not be used to support any 21st century map types – especially choropleth maps. Treating lines of longitude as if they were Cartesian parallels always always always creates non-uniform distortion patterns and areal exaggerations that inflict bias into large-area displays. argh.
i bet the mercator thing had to do with ease-of-use. the stamen guys are too good not to have that in the back of their minds, so i’ll be looking out for those projection options :)
Plus Google Maps and Bing Maps both use Mercator projection, so existing tiles and tile-generation systems can be reused, which should aid adoption and mashups.
This is a vector based system, so if people really want this then I suppose it’s a straightforward mapping in JavaScript with no loss of image quality. Google Maps supports custom projections, though I don’t know if they bend images on the client or not.
From http://polymaps.org/ex/transform.html
“Image tiles don’t have to be in spherical Mercator coordinates. Polymaps can translate, rotate, scale and shear a tileset using an affine transformation, so that any zoomable image can be overlaid onto a map.”
Pingback: Lesenswerte Artikel 23. August 2010
Pingback: Recent Links (weekly) « Innovation Emerges…Anywhere
Pingback: Weekend Hack | Mental Notes