It was a huge year for data. There’s no denying it. Data is about to explode.
Applications sprung up left and right that help you understand your data – your Web traffic, your finances, and your life. There are now online marketplaces that sell data as files or via API. Data.gov launched to provide the public with usable, machine-readable data on a national scale. State and local governments followed, and data availability expands every day.
At the same time, there are now tons of tools that you can use to visualize your data. It’s not just Excel anymore, and a lot of it is browser-based. Some of the tools even have aesthetics to boot.
It’s exciting times for data, indeed.
Data has been declared sexy, and the rise of the data scientist is here.
With all the new projects this year, it was hard to filter down to the best, but here they are: two honorable mentions and the five best data visualization projects of 2009. Visualizations were chosen based on analysis, aesthetics, and most importantly, how well they told their story (or how well they let you tell yours).
Honorable Mention: MTV VMA Tweet Tracker

The MTV VMA Tweet Tracker, a glorified bubble chart from Stamen Design and Radian6, showed the buzz on Twitter over the MTV VMAs. As I watched iJustine talk about the visualization on television, pointing out highlights in the bubbles and tags, I thought, “Visualization sure has branched out.” Plus, the explosion of Kanye West’s face on my computer screen was hilarious.
Honorable Mention: Crisis of Credit Visualized

We all know there were major problems going on with banks and credit this year, but it’s a safe bet that most didn’t quite know why. Jonathan Jarvis attempted to explain with his thesis project, Crisis of Credit Visualized. It isn’t perfect, and it doesn’t explain every detail, but it does explain a lot.
5. Photosynth

Photosynth, by Microsoft Live Labs, smartly strings photos together to create something of a browsable 3-D environment. It was actually released last year. I don’t think it was really put to good use until this year though. With the inauguration of President Barack Obama, a historic event people won’t soon forget, MSNBC used Photosynth to provide a view of the inaugural stands.
4. The Jobless Rate for People Like You

Unemployment rate was another important and recurring topic this year, and there were a lot of visualizations – maps, bar charts, and graphics – that showed it. None did it better than Shan Carter, Amanda Cox, and Kevin Quealy of The New York Times. In The Jobless Rate for People Like You, we were able to see the changes over time and filter down to different demographics. Transitions and browsability were top notch.
3. OpenStreetMap: A Year of Edits

OpenStreetMap: A Year of Edits showed all the changes to OpenStreetMap data in 2008. The visualization itself, by ITO, is beautiful, and what the animated map represents – a worldwide effort in providing an accurate geographic data source – is even more amazing.
2. Protovis

Protovis, from the Stanford visualization guys Mike Bostock and Jeffrey Heer, is a “graphical approach to visualization.” More importantly, it uses Javascript and SVG for web-native visualizations, which is where things are headed with, uh, visualization on the Web. True, there are plenty of Javascript libraries that let you make basic graphs, but none are nearly this advanced, and true, Protovis doesn’t work in all browsers, but if you’re reading this, you’re probably smart enough to be on a modern browser, unless you’re locked into Internet Explorer at work.
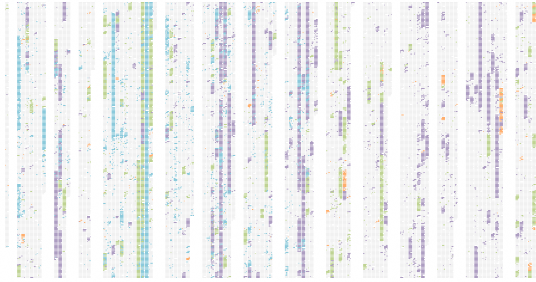
1. On the Origin of Species: The Preservation of Favoured Traces

On the Origin of Species, by Ben Fry, shows the changes to Charles Darwins’ theory of natural selection, over time. I think a lot of you missed this one, because I posted it on Labor Day, but nevertheless, it’s an elegant visual. It’s a simple concept executed really well. Origin shows the full growing (and shrinking) text as little blocks with an emphasis on the evolution of Darwin’s ideas. They were 20 years in the making.
Origins is actually an offshoot of a much larger project yet to be released (if ever), according to Fry, so I’m of course really looking forward to seeing the rest.
There you have it. It’s the top five visualizations of 2009. There was a lot of great stuff churned out this year, and no doubt next year will be even better.
Back to you – what do you think was the best visualization of the year? Leave your picks in the comments below.
 Visualize This: The FlowingData Guide to Design, Visualization, and Statistics (2nd Edition)
Great roundup…I was definitely a fan of the above (particularly the NY Times and Ben Fry’s projects). I also loved the Digg365 project by The Barbarian Group http://labs.digg.com/365. The open approach of Flowing Data tutorials and Guardian’s sharing of data sets on their Data blog (http://www.guardian.co.uk/news/datablog) have also become personal favorites in terms of learning. I also enjoyed this NY Times Super Bowl Twitter chatter piece http://www.nytimes.com/interactive/2009/02/02/sports/20090202_superbowl_twitter.html
Pingback: Simon Cockell | 5 Best Data Visualization Projects of the Year – 2009 | FlowingData | Fuzzier Logic
I really like protovis. It has a huge potential.
“True, there are plenty of Javascript libraries that let you make basic graphs, but none are nearly this advanced, and true, Protovis doesn’t work in all browsers, but if you’re reading this, you’re probably smart enough to be on a modern browser”
My JavaScript InfoVis Toolkit (http://thejit.org) could be a good approach for writing *advanced infovis stuff* with web standards and *support for IE* also. Oh, and it makes *super advanced visualization stuff*, just sayin’
Pingback: ScribeMedia.Org: The Business, Technology and Culture of Digital Media
Pingback: Cool data visualizations, 2009 « Rob on Ruby (and Java)
Your list is great, Nathan! Thanks for including Jeff and Mike’s open source Protovis toolset and Ben Fry’s evolution of the Origin of the Species vis. They change the landscape this year! I would love to add a nod for the coolest visualization-based Design Studio – the great SF folks at Stamen Design http://www.stamen.com (Eric Rodenbeck, Michal Migurski, Shawn Allen, Tom Carden, et.al.). They have too many great ones to count but your MTV Tweet Tracker bubble chart top pic by them is a 2009 favorite of mine.
One that didn’t make this list, but should receive attention is Qvinci. http://www.qvinci.com Qvinci Software, a SaaS, launched at the end of last year as a new way for small to mid size businesses understand their financial data in one central dashboard. It allows you to combine QuickBooks financial data with Excel operational data to create true business intelligence that small businesses can actually use to make management decisions.
Pingback: 5 Best Data Visualization Projects of the Year – 2009 | FlowingData « urban-listening
Pingback: Jonathan Stray » Best Visualizations of 2009
Pingback: High Performance Organisations » Blog Archive » 5 Best Data Visualization Projects of the Year – 2009 | FlowingData
Pingback: FlowingData’s 5 Best Data Visualization Projects of 2009 | VizWorld.com
Pingback: Lesezeichen vom 16. Dezember 2009 | PolkaRobot
Pingback: CFS Loves 46 | Code For Something
“[…]shows the changes to Charles Darwins’ theory of evolution over time.”
Darwin did not discover evolution, or theorize it. He proposed the theory of natural selection–a component of a much larger theory: evolution. Evolutionary theory existed long before Darwin did.
Nietzsche – Are you seriously trying to say that “Darwin’s Theory of Evolution” isn’t a legitimate phrase? You’re either pedantic or trolling. Move along.
Pingback: List of 5 Best Data Visualization Projects of the Year – 2009 « The Yale Graphic Design Preliminary Blog
Pingback: Timothy M. Kunau » OpenStreetMap’s Annual Animated Updates (2008)
Pingback: Five Best Data Visualization Projects of 2009 « ResourceShelf
How about at Style Chart? Compare with Protovis, it’s more server based.
Pingback: VizThink Blog » Blog Archive » VizLinks | Visual Thinking Bookmarks for December 17th
Pingback: Ukens anbefalte - 19 December 2009 | Raymond Karlsen
Pingback: igorbrejc.net » Fresh Catch For December 19th
Pingback: Community-Chest » Bookmarks for décembre 18th through décembre 20th
Pingback: 5 Best Data Visualization Projects of the Year – 2009 | FlowingData « Andy Oakley
Pingback: 5 Best Data Visualization Projects of the Year – 2009 « Bytes Hotdish
Pingback: Suprageography » Blog Archive » Season’s Greetings
Pingback: 5 Best Data Visualization Projects of the Year – 2009 | FlowingData « dim2w
http://berglondon.com/projects/hat/
One company that’s caught my eye over the past year is the Berg design firm (formerly Schulze & Webb). Their interdisciplinary approach to design has resulted in a number of innovative and smart uses of data. The project entitled “Here and There” approaches visualizing geographic spatial data in a way that I’d never seen before, building meaningful relationships between elements (buildings, streets, island and water, color codings, grids, etc.) in the visualization of the City. Based on the simple premise of a dynamic point of view (imagine flying overhead in the motion of a growth curve), the work builds an interesting perspective of an already well-known space. Important to note is the less obvious complex interaction between the representation of scale and a shifting point of view. Louder but softer.
Pingback: links for 2009-12-29 | Chrome Bits
Pingback: Bilan 2009, perspectives 2010 | Owni.fr
Pingback: CVFblog » Blog Archive » Double Project: Link
Pingback: this is a blog » Blog Archive » Track Your Way Through 2010
Pingback: Congratulations to my client Stamen Design for MTV VMA Tweet Tracker recognition « ExecuShiftâ„¢
I would go with MTV one, the species visualization is great too but I think not many could make out sense from it. Most people would not understand at the first instance what it stands for.
Good ones there !
Pingback: » FlowingData’s Best Visualizations Of 2009 Karl Reinsch’s Blog
Pingback: Top data vis projects of 2009 « *xa.