Visualization
Showing the stories in data through statistics, design, aesthetics, and code.
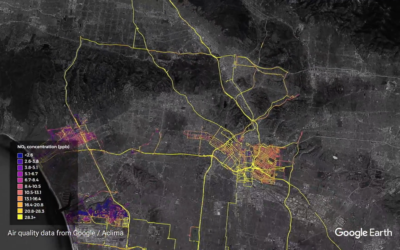
Google maps street-level air quality using Street View cars with sensors
Google equipped their Street View cars with air quality sensors and sent them…
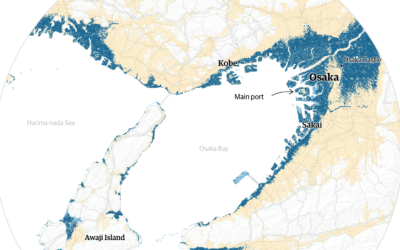
Cities projected to be under water by 2100
Using Climate Central sea-level rise estimates, The Guardian plots and maps the potential…
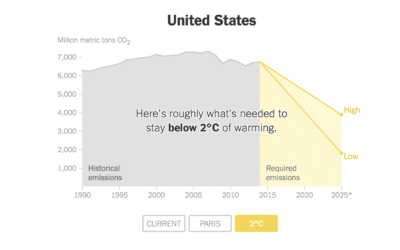
Carbon emissions goals vs. current paths
Brad Plumer and Nadja Popovich reporting for The New York Times:
Under the…
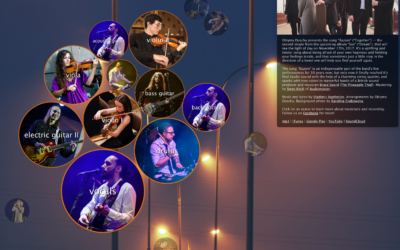
Visualization song release
Ukranian band Obiymy Doschu released a new song Razom. “It’s a uplifting and…
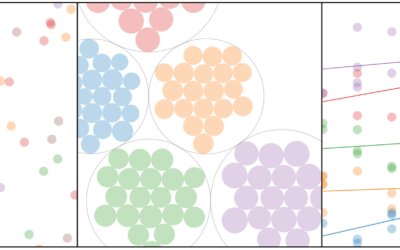
Visual explainer for hierarchical modeling
Hierarchical models, or multilevel models, are used to represent data that might vary…
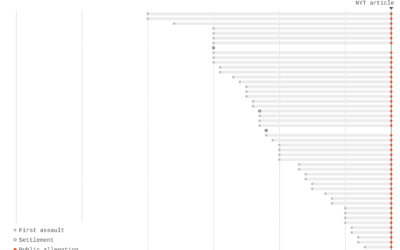
Charts show time between assaults and public allegations
As the list of sexual assault allegations grows for Harvey Weinstein (and many…

Sorting algorithms visualized with animated color palette
I bet you woke up this morning thinking, “I haven’t seen a good…

Visualizing fertilization of egg by sperm at the atomic level, with a Star Wars theme
Don Ingber and Charles Reilly of the Wyss Institute used data at the…

A study of the geographic forms in cartography
Cartographer Geraldine Sarmiento from Mapzen explores the drawing forms in cartography, such as…
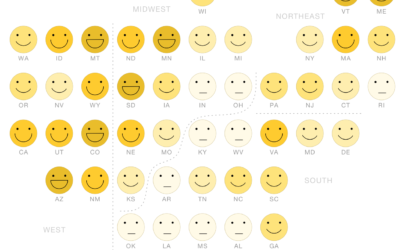
Mapping happiness
Gallup surveyed Americans about their well-being across various factors. National Geographic gets into…
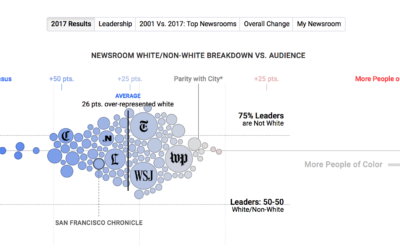
Statistical diversity in US newsrooms
If a news organization wants to talk about the world in a fair…
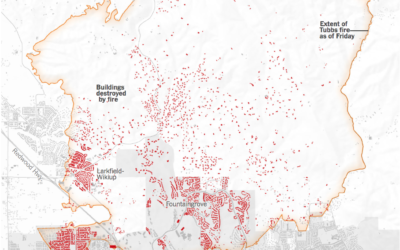
Map of Santa Rosa fires
Using both satellite images and ground surveys, The New York Times maps the…
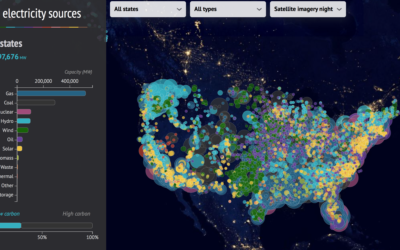
US electricity sources map
This interactive map from CarbonBrief shows how America generates electricity. Each circle represents…
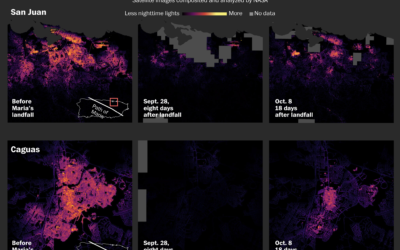
Darkness mapped in Puerto Rico
Three weeks in, much of Puerto Rico is still without power. Denise Lu…
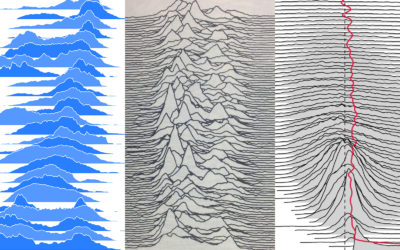
Frequency trails chart explainer
Frequency trails, or currently better known as joyplots, is a visualization method to…
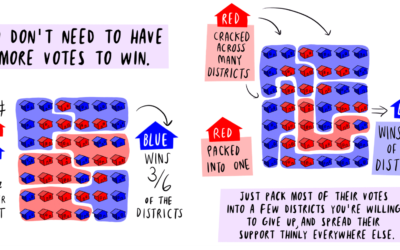
Math to fix gerrymandering, explained in comic
Gerrymandering doesn’t sound like an especially sexy topic, but it’s an important one…
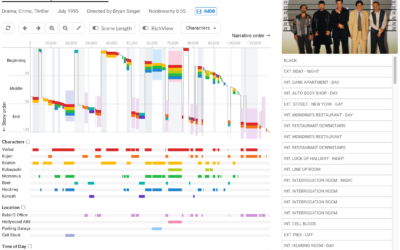
Visualizing nonlinear stories
Many stories don’t follow a linear format. There are flashbacks, or multiple timelines…
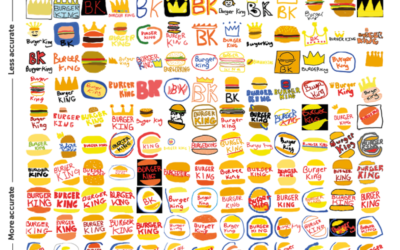
Logos drawn from memory
Signs asked 150 people to draw famous logos — Apple, Starbucks, Burger King,…