Visualization
Showing the stories in data through statistics, design, aesthetics, and code.

Celebrating the joy of metering →
Meters, by Berlin-based designers Patrick Kochlik and Monika Hoinkis, celebrates the joy of…
Short film imagines life with data and constant digital
In the what-happens-when-technology-takes-over-our-lives genre, Sight by Eran May-raz and Daniel Lazo, imagines a…
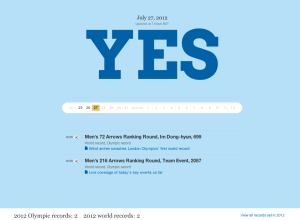
Track and field Olympic performances in perspective →
We’ve been hearing Olympic records rattled off for the past week, but it’s…
Olympic rings as data symbols
Artist Gustavo Sousa used the Olympic rings as data indicators for statistics like…
What planets would look like if they replaced our moon
Artist Brad Goodspeed imagined what the planets would look like if they were…
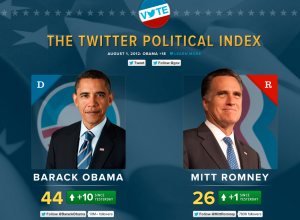
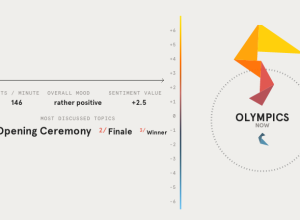
Twitter Political Index measures feelings towards candidates
In partnership with social analytics service Topsy, Twitter launched a Political Index that…
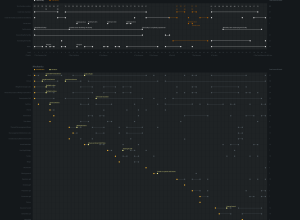
Network of political contributions →
The Wall Street Journal visualized major political contributions, according to the Federal Election…
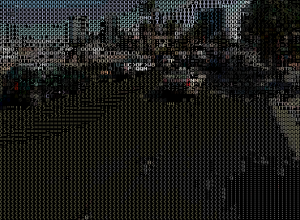
Ascii Street View →
Peter Nitsch created Ascii Street View, converting Google Street View to colored letters.…
Map of connections in the human brain
Using a new kind of MRI scanner, scientists at the National Institutes of…
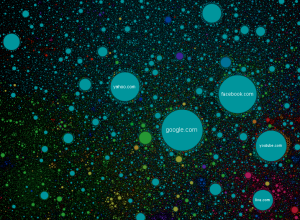
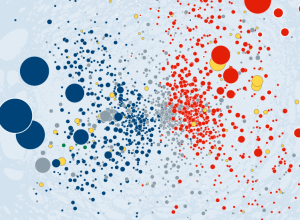
Map of the Internet
Ruslan Enikeev created a searchable Internet map of links and bubbles, showing over…
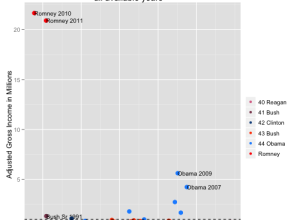
Comparing Romney’s tax returns to presidential returns →
Lee Drutman, a Senior Fellow at the Sunlight Foundation, compared the tax returns…
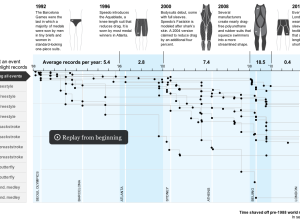
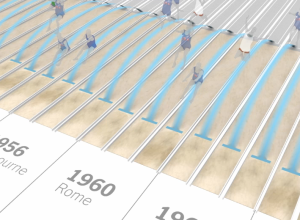
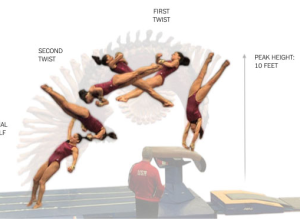
Swimsuit technology and breaking world records
The Washington Post has a fine graphic on swimming world records and the…
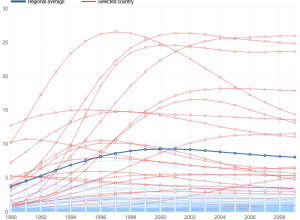
Tracking the spread of AIDS →
Adam Cole and Nelson Hsu for NPR plotted the percentage of people, ages…
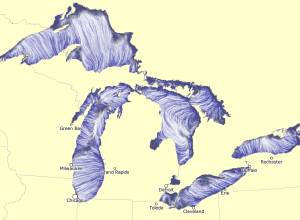
Great Lakes currents map
Using the same tech Martin Wattenberg and Fernanda Viegas created to show wind…