Visualization
Showing the stories in data through statistics, design, aesthetics, and code.
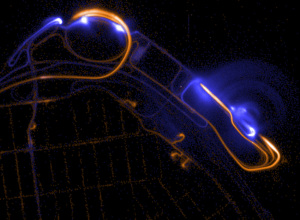
Bass Shapes visualizes sound in hand-drawn style
Media artist Nick Hardeman’s audio visualization app Bass Shapes was rejected by the…
Visualizing algorithms →
Mike Bostock, who you might recognize from such things as Data-Driven Documents or…
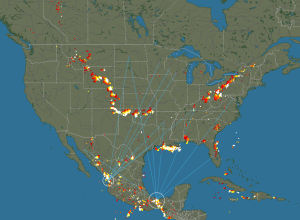
Real-time lightning map
Blitzortung is a community of volunteers who install inexpensive lightning sensors and transmit…
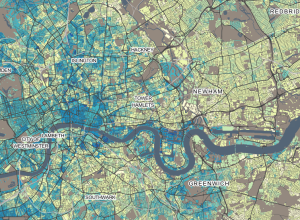
Detailed UK census data browser
DataShine Census provides a detailed view into United Kingdom 2011 census data. Population,…
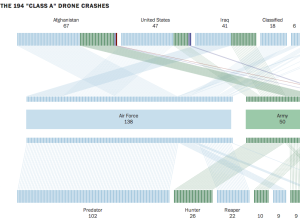
Drone crash database →
Based on data compiled from a combination of military records, Defense Department records,…
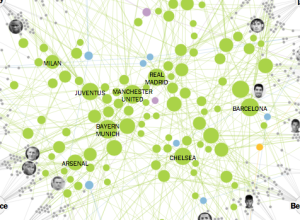
Clubs that connect World Cup national teams →
Gregor Aisch for the New York Times explored how the soccer clubs that…
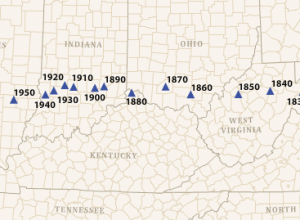
Watch the U.S. population center shift west
According to the U.S. census, the mean center of the population shifted west…
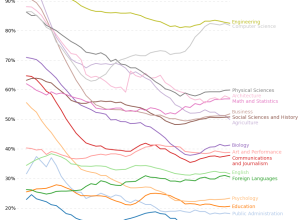
Percentage of degrees conferred to men, by major
Based on estimates from the National Center for Education Statistics, Randy Olson plotted…
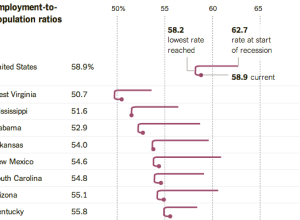
Employment-to-population ratios →
The Upshot posted an interesting chart that shows changing employment rate by state.…
OpenGeofiction, the creation of an imaginary and realistic world
Sharing the same collaborative principles as OpenStreetMap, a wiki-based map for the real…
What separates here from there
New Scientist quickly covers three theories of space and time in an informational…
A visual analysis of the Boston subway system
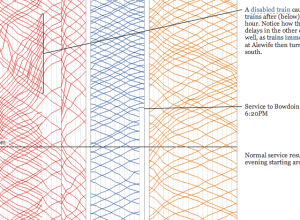
For a graduate project, Michael Barry and Brian Card explored the Boston subway…
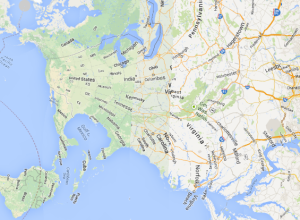
Mercator projection with pole shifted to where you live
Drew Roos made a thing that lets you move the poles of the…
Jobs recovery and loss, by industry →
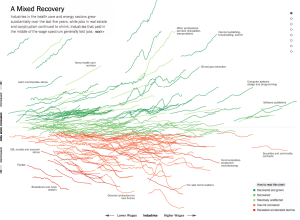
Jeremy Ashkenas and Alicia Parlapiano for The Upshot just plopped this interactive sucker…
NFL players getting bigger
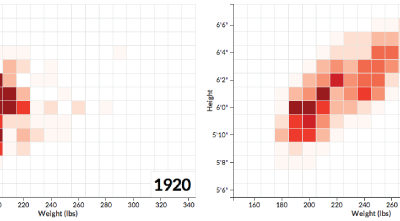
Football players are getting bigger. Noah Veltman, a developer for the WNYC Data…
Using open data to find the perfect home
Justin Palmer and his family have lived in a dense urban area of…

