Visualization
Showing the stories in data through statistics, design, aesthetics, and code.
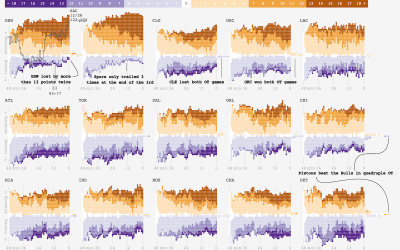
Small multiples for NBA game differentials
Adam Pearce charted minute-by-minute point differentials for NBA games during the 2014-15 season.…
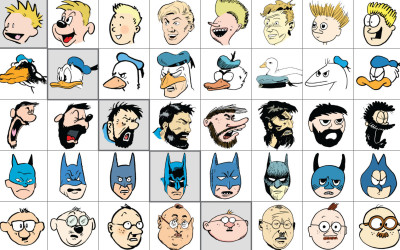
Same source, different styles →
Jaakko Seppälä drew ten comic characters, each in its original style and in…
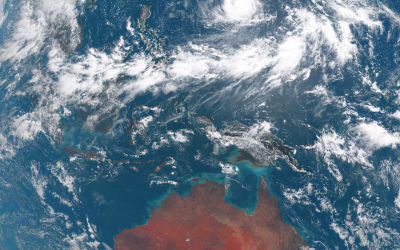
Satellite time-lapse of Earth
Charlie Loyd, who works with satellite imagery at Mapbox, put together a 12-second…
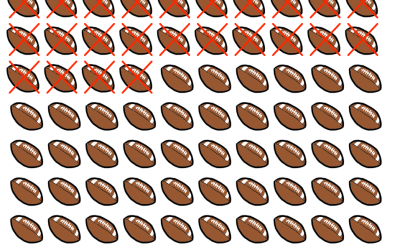
Counting your days left with emoji
While we’re on the topic of life expectancy, Tim Urban of Wait But…
Punctuation only in literary works
What do you get if you take famous literary works, strip out all…
Immigration history
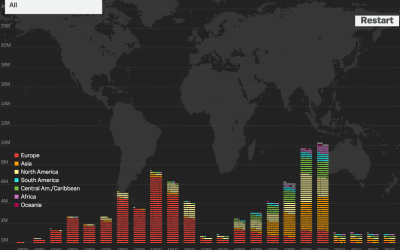
American immigration history is chock full of policies and restrictions, and you can…
Antibiotic history and the winning bacteria
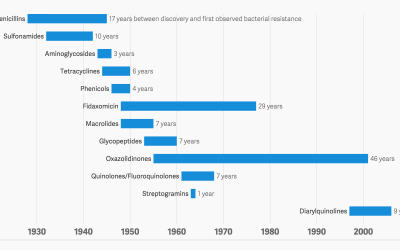
We take antibiotics. Bacteria dies, but some lives, evolves and develops a resistance…
Visual breakdown of additives in food
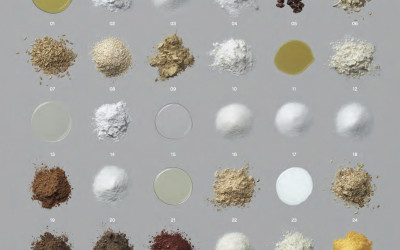
In their book Ingredients, Dwight Eschliman and Steve Ettlinger explore additives in common…
Shakespeare tragedies as network graphs
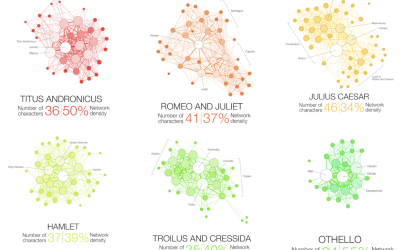
Martin Grandjean looked at the structure of Shakespeare tragedies through character interactions. Each…
Atlas of United States history
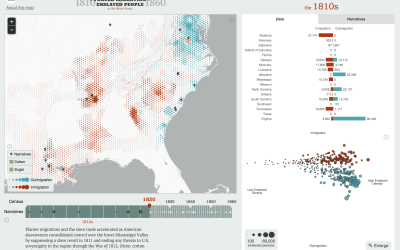
In a collaboration between the Digital Scholarship Lab at the University of Richmond…
10 Best Data Visualization Projects of 2015
These are my picks for the best of 2015. As usual, they could easily appear in a different order on a different day, and there are projects not on the list that were also excellent.
All known planets outside our solar system
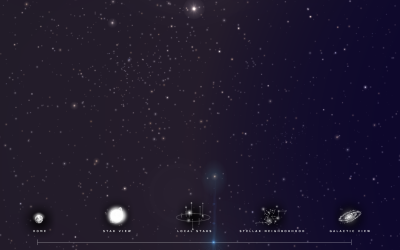
Jan Willem Tulp, in collaboration with Visualized, shows all known exoplanets (currently 1,942…
Timelines show Star Wars character interactions
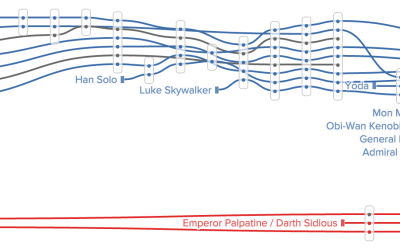
Remember when xkcd charted character interactions for fictional stories? Inspired by that and…
Tinder robot behaves to palm sweatiness
Take all the guesswork out of finding “love” on Tinder, and let the…
Blueprint for a carbon-free world
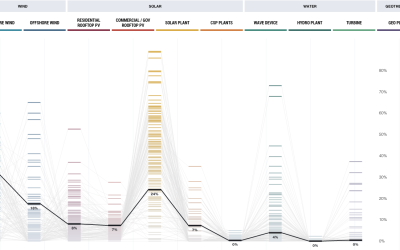
Getting to 100 percent renewable energy seems like such a far away goal…

