Like what you see? Subscribe to the feed to stay updated on what’s new in data visualization.
When I saw Toby’s Walmart growth video a while back, I was intrigued by what other time-location data Freebase had. A few commented on how it’d be interesting to map the spread of Starbucks along with Walmart and other businesses. I agreed. So I looked, but as it turns out, there’s not a whole lot of opening dates for business other than Walmart. In fact, about 2/3 of the Walmart locations don’t even have dates. Sigh. Maybe another day. Instead, I used the Walmart data as a learning exercise.
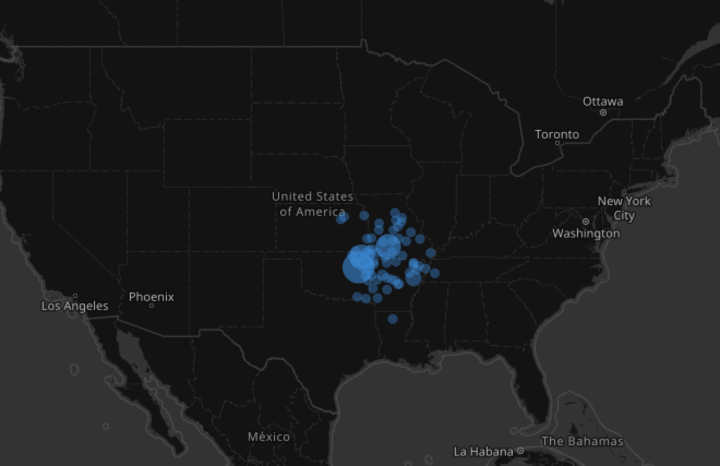
My Own Walmart Growth Video
Yesterday I quickly put together my own Walmart growth video using Modest Maps. It has the usual mapping features – panning and zooming – while you watch Walmart spread like wildfire. It starts out slow with the first location in Arkansas in 1962 and then spreads vast in a hurry.
You’ll notice it looks a bit like Trulia Hindsight, because yes, I’m a biter. But hey, imitation is the sincerest form of flattery, right? Actually I just find that trying to recreate things helps me learn more efficiently. Thanks, Tom for the tip on TweenFilterLite, which makes tweening and filtering a lot more straightforward.
UPDATE: Due to popular demand, I added year and store count to the mix. Now for some dramatic music.
UPDATE 2: I got my hands on the complete data (yeah!) and cleaned up the locations, so no more missing stores or stores in the ocean up until 2007.
 Visualize This: The FlowingData Guide to Design, Visualization, and Statistics (2nd Edition)
Hey, Nathan, still remember me? I’m the guy talking about animations in DataViz VI :)
I have a minor suggestion here. Why not add some statistics to the video (such as the number of markets, the time line, or even the 2D density, …) so that we can have a more precise recognition about the growing process?
Nice one – the background map looks really good – how did you do it? Flash filter on a Yahoo/Google map – or is it a composite?
Yihui – yup, i remember. the main reason is that it was mostly a learning exercise so i was working on what i didn’t know how to do first, and then the day ended :) but i’ll be sure to include some statistics on the next round of things.
Moritz – yeah, you got it. it’s a flash filter on a Microsoft map. i’ll put up the code next week.
would love to see this for other retail outlets: best buy, circuit city, mcdonalds, etc. very cool, thanks.
hey, some of my co-workers zoomed out and noticed there is one store off the coast off west africa. perhaps a small DB error?
Chrissie – good catch :). on a quick glance at the data, it looks like there were some zipcodes that freebase didn’t have latitude and longitude for, so those walmarts end up at lat/lon 0/0 – in the middle of nowhere.
I love the state-by-state growth … slow expansions into neighboring southern states, studious avoidance of the northeast and west coast, and then BAM. Can you display the years?
Michal – Shoot, I must’ve accidentally edited out that the flurry at the end is from all the stores missing their “opening date” in freebase, so it’s not quite as exciting :P
i really do need to get that year and store count in though.
Pingback: Mapping Walmart’s Expansion : Alexia Golez
There is missing data or it’s out of sequence. The animation shows Walmart didn’t invade Texas until after 2001? I know that can’t be right. Is it becasue the ???? dated data points at the end of the animation account for the lack of data points in Texas pre-2001. I’m in Texas if you couldn’t guess. I think Dairy Queens and Walmarts have been in Texas since it’s admission to the Union ;-)
No stores in New Jersey? Huh?
I couldn’t understand why there were no Walmarts shown in CA until the end, then I finally realized that you didn’t have correct opening dates for CA stores. I think they started opening stores in CA in the mid-80s.
The weird thing: if you zoom out you’ll see there’s one off the coast of Africa? What’s that all about?
Like Tony in TX noted, there is some missing data. I lived in central FL and I recall the first Wal-Mart in the (then) little town opening in the mid to late 80’s, and then there were numerous Wal-Marts throughout central FL by 1990. I was also thinking like Crissie and curious about other retailers (Dollar General?). I have noticed there are no Wal-Marts in the Florida Keys and I can’t say I care! I love-hate Wal-Mart. I try to avoid it for the most part.
Anyway, it’s really cool what you did. :)
Nice visualization, but the data is incomplete. Almost all of New England seems to be missing. Good job anyway, though.
Nice visualization, but the data is incomplete. Almost all of New England seems to be missing. Good job anyway, though.
Nice work. You can also put the title: “CDC Simulation of an Outbreak of (insert bad virus name here)” and I would believe it.
Nice work. You can also put the title: “CDC Simulation of an Outbreak of (insert bad virus name here)” and I would believe it.
Pingback: Click | Cook | Play
Awesome.
I know for sure there were some Walmarts in Houston, TX area in the early to mid 1980s. Not in every town like there is now, just a few.
Don’t forget about Alaska and Hawaii We have Wallmarts there too. AND we are states in the United States. If you want to make your data a bit more acturate I suggest you add them.
I have seen maps like this before, but this is the best by far. Nicely done! The only thing that would really take it to the next level would be international growth in Mexico, Europe, Asia–and then constriction when Wal-Mart loses out and closes stores–such as in Germany and Korea.
One question: Is there any way to get/make a copy of this as a media file for use in a lecture. It would be even more useful if shared in a classroom. I would, of course cite the source!
Really neat. I’m intrigued if there was ever a store closure or move to different premises, and how you would show that. I would envision a red flashing dot for closure or concurrent orange a green dots for a move? That would be a great “rise and fall of” visualisation for any enterprise that grew and then bit the dust for any reason.
Also what about takeovers? Walmart bought the sizeable Asda chain in UK a year or 2 back. A different shade of green perhaps?
graham – the hard part is getting the data :/
Great animation, be very interesting to see this on a worldwide basis. The acquisition of ASDA in the UK for example would appear like a bomb.
Pingback: JAMES FREY » Blog Archive » The Green Areas Indicate Where The Cancer Has Metastasized
A minor detail, but the cylindrical map projection doesn’t really work over any significant North South distance. Can you use a more realistic projection that doesn’t distort the US so much?
Kris – what projection do you suggest?
Absolutely love this animation. Best one I’ve seen…
Hope you don’t mind, but I “borrowed” it and added some drama and dialogue.
http://www.youtube.com/watch?v=ojLQ2t6N1EU
Nothing against Wal-Mart per se… just when I saw your video, it reminded me of the famous “Agent Smith” speech…
I’m sure if you could find similar data, you could take many popular chains, apply this same treatment and have the same effect. Imagine the plotting out the spread of McDonald’s over the past 60 years?
Rich – hehe, that was entertaining. thanks
Great job. It would be interesting to see one of these for Starbucks (and then show the closing of the stores as well)
Great job. It would be interesting to see one of these for Starbucks (and then show the closing of the stores as well)
the virus spreads.
the virus spreads.
the virus spreads.
Nathan,
Is someone reposting your content…?
Nathan,
Is someone reposting your content…?
Nathan,
Is someone reposting your content…?
Andrew – THANK YOU for the heads up. i deleted the link in your comment so as not to give that site any publicity. punks.
Andrew – THANK YOU for the heads up. i deleted the link in your comment so as not to give that site any publicity. punks.
Andrew – THANK YOU for the heads up. i deleted the link in your comment so as not to give that site any publicity. punks.
Pingback: America » Biking Across America: Day 5, Pain
30ware:
“Great job. It would be interesting to see one of these for Starbucks (and then show the closing of the stores as well”
PLEASE, yes, please replicate this for Starbucks.
Pingback: Michael VanDaniker » Blog Archive » Heat-Mapping the Spread of WalMart
HaHa!, Nice to see that AmeriKKKa continues to consume beyond the means of the planet…One wonders if the consumer society will eventually lead to this benighted country disappearing up its own fundament!
I wonder if Walmart and Starbucks look the same??? I wonder just how many people walmart employs. It just goes to show you how many people need or want to save money????.
San Jacinto, CA has a super walmart. >)
Where are those opened in Canada? Is Canada still part of “America”?
Fantastic effort!
I would also love to see a non-US-centric version of this -i.e. Canada, Mexico, Germany etc…
See my discussion of this at: http://internationalbs.wordpress.com/2009/01/08/spreading-like-wildfire-wal-mart-on-the-move/
Great map, but you show no Wal-Marts in Alaska and I know we have at least 3.
Great effort! The Walmart “green dot” in my hometown (Hazleton, PA) is not in the downtown area. It is located outside the city in Hazle Twp. about five miles … close enough. ;-)
Great effort! The Walmart “green dot” in my hometown (Hazleton, PA) is not in the downtown area. It is located outside the city in Hazle Twp. about five miles … close enough. ;-)
For those seeking to build a Starbucks version, there do appear to be some lists of opening dates floating aorund (and closures). Can’t vouch for their completeness/accuracy:
Openings (recent): http://www.starbuckseverywhere.net/NewStores.htm
Openings (older):
http://www.starbuckseverywhere.net/StoreOpeningDates.htm
Closings (2008 round0:
http://www.starbucks.com/aboutus/USStoreClosureInfo.pdf
Perhaps there’s more info inside this rather odd site (a guy trying to visit them all!!)”
http://www.starbuckseverywhere.net/
@Andre – Thanks for the links. I came across the same pages a while back. Unfortunately, they’re not quite complete. Starbucks has about 15,000 stores worldwide, 7,000 U.S. company-operated stores, and 4,000 licensed U.S. stores
@Andre – Thanks for the links. I came across the same pages a while back. Unfortunately, they’re not quite complete. Starbucks has about 15,000 stores worldwide, 7,000 U.S. company-operated stores, and 4,000 licensed U.S. stores
I echo the comments about Alaska. I’m in Fairbanks and there is a Walmart here as well as other locations within the State.
I echo the comments about Alaska. I’m in Fairbanks and there is a Walmart here as well as other locations within the State.
congrats on the Chronicle of Higher Ed mention
http://chronicle.com/review/brainstorm/bousquet/excellence-in-america-the-epidemiology-of-wal-mart
congrats on the Chronicle of Higher Ed mention
http://chronicle.com/review/brainstorm/bousquet/excellence-in-america-the-epidemiology-of-wal-mart
Pingback: Pink Asparagus » Data Visualization
Nice animation. Very effective. The one thing that really takes away from the cartographic presentation is the absence of an appropriate map projection however.
Try applying an appropriate conic and the map will be much more effective.
You are missing a store in Lawton, OK. We have two. You’re missing the location on Sheridan Rd. (It’s the older of the two)
And Marlow, OK is missing completely.
hey…you completely missed or misplaced three of the walmart stores in my area (Cleveland/Akron). In other words, the map is inaccurate and misrepresents store density.
If you are going to do something, do it right!
I would like to see this for the spread of geocaches. I’m guessing that in order to do that you would have to work with geocaching.com and or Groundspeak to be able to get all the data easily.
Hey dickhead, you’re really living up to your name! Build your own map so we can publicly pick it apart and give you grief over it! :-)
As a non-geek (in the computer sense only–otherwise I’m as nerdy as they come), I feel a bit po’ faced about offering this suggestion.
I just showed the visualization to a friend, Steve Carlson, who helped spearhead a successful campaign to block a Walmart in Spooner, WI, and a thought struck me.
Wouldn’t it be cool to map in all the places where community opposition has blocked Walmart’s expansion plans (a couple of hundred so far, I understand)? It’d be nice to watch how the spreading infection sparks the development of anti-bodies in the country…
Pingback: Google Earth Visualization » Growth of Wal-Mart, Google Earth Animation
Dude this is awesome. I would really like to see this for their international expansion. Interestingly could you load this for Carrefour, Costco, and Tesco? Maybe Metro AG?
Pingback: Retail Store Data Visualization « Breakfast at Nancy’s
Pingback: The best of Data Flow « Infografia em base de dados
Pingback: EclecticLip » Target v WalMart
What a great map!! Very cool (and kinda scary at the same time). Are those just Walmart stores? or does it include Sam’s club?
What a great map!! Very cool (and kinda scary at the same time). Are those just Walmart stores? or does it include Sam’s club?
this is cool, though i would love to see the international level too. i’m from mexico and theres been a virus like growth of wal mart and walmart-owned (sam’s club) and -bought up (suburbia, aurrera, vips) outlets in the last, say, seven years. i dont know about other countries but it would ass a whole other dimmmension to your project…
Great website and map! I’m old enough to remember the vast variety of stores that were all over the nation. Today, shopping is extremely boring. All stores are the same now. With all the laws and censorship, young people are living in a very boring time and they don’t even know it.
Pingback: James Wanless » journal » Is it Cancer or Walmart?
This is so awesome Nathan! I’m glad to see that you’re doing so well in your study and work! :-)
Great chart for USA but I also sell to almost 300 Walmart stores here in Canada. Walmart Canada bought the assets and many of the store locations of the Woolco / Woolworth’s chain in 1994. At that time only about 130 stores. Walmart Canada has more than doubled since then.Thought you should know !
stupid americans, when will they learn life isnt all about money!!