
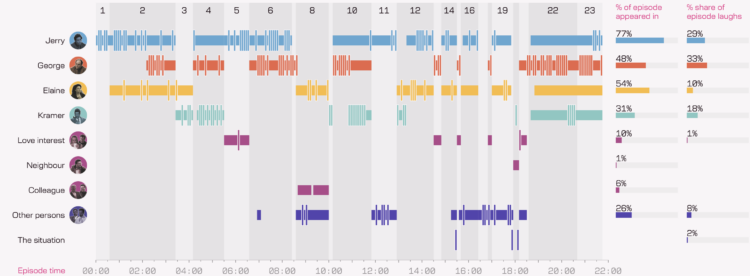
Several years ago, Andy Kirk watched every episode of the sitcom Seinfeld, all the while collecting data in five-second increments. He visualized the data in book-form, but now there’s a fun digital version of the project he calls The Seinfeld Chronicles.
The data collection process, while watching each episode twice, sounds like the most tedious part of the project:
[W]ith so many episodes to work through, a pragmatic approach was required to ensure the best quality data could be obtained in the most efficient way. Typically, each episode’s data was gathered through two full viewings. The first viewing would focus on recording the times of when discrete scenes started and finished, the locations in which these scenes were set, and when characters appeared on-screen in those scenes. The second viewing was done to validate the first-pass data and additionally capture details about which characters caused the observed audience laughter.
To help with the efficiency of the data collecting, all measurements were recorded in and against units of 5-seconds periods. This approach offered sufficient granularity to accurately quantify a character’s appearance and laughter contributions and, as explained earlier, aligned with the typical length of a moment of audience laughter.
That’s a lot to watch. I don’t think I have the patience or stamina to collect data like that, even for my favorite shows at their peak. So kudos to Andy for this very “unnecessary” exploration.
 Visualize This: The FlowingData Guide to Design, Visualization, and Statistics (2nd Edition)
