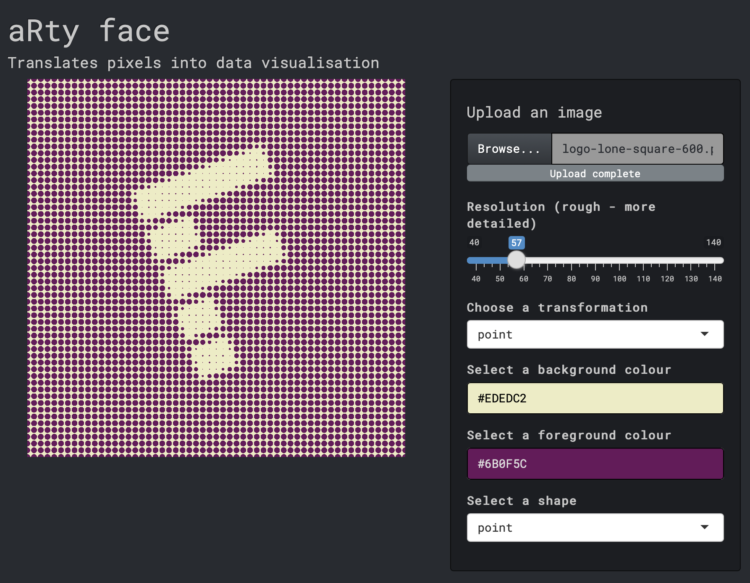
Here’s a fun interactive by Duc-Quang Nguyen. Upload an image and get back a transformed visual that uses dots, lines, or ascii. Use the menu options to easily change resolution, colors, and shapes.
It’s a combination of Georgios Karamanis’s code and Elana Levin Schtulberg’s experiment of the same ilk.
 Visualize This: The FlowingData Guide to Design, Visualization, and Statistics (2nd Edition)