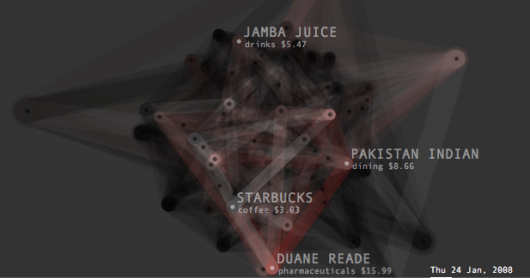
Transactions Graph, by Burak Arikan, is a piece placing personal transactions in network graph. Each node represents a transaction while connections (or edges) shows a relationship between transactions based on time and spending category. The thicker the edge the greater the total of the two connected transactions. Viewers are also able to scroll through time to watch how transactions evolve.

Transactions are updated daily (via a transactions feed), and somehow the transaction graph is used to predict future spending, but I’m not quite feeling that part of the piece.
[Thanks, Tom]

 Visualize This: The FlowingData Guide to Design, Visualization, and Statistics (2nd Edition)

Hey Nathan, Burak’s description of the “predictive capacity” of MyPocket is quite elegant. I like the way he has framed this project as creating a system, and him having a personal relationship with it.. it affecting his activities and vice versa. That part of the project sits outside the experience of the visualization, but it is nice to see a infovis project that has a life off the screen and an argument/polemic that runs parallel to it.
Regardless, it is a disciplined exercise in self-surveillance!
Thank you for posting it Nathan.
Transaction Graph is one of the three interfaces to the MYPOCKET project. You can see the other two here:
Transactions Feed
http://mypocket.burak-arikan.com/bank_transactions
Predicted Objects
http://turbulence.org/Works/mypocket/predicted_objects
MYPOCKET is a live system that opens my financial records to the world, and using these records, it tries to predict my future spending.
http://turbulence.org/works/mypocket