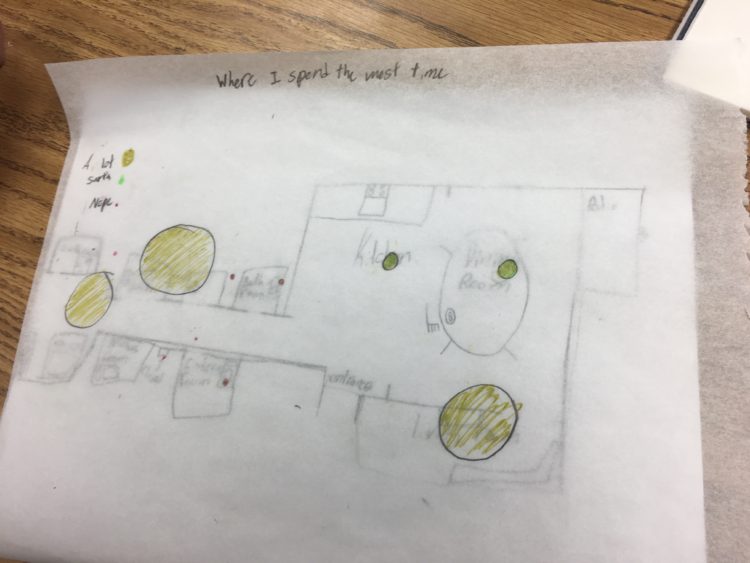
Jonathan Schwabish gave his fourth-grade son’s class a lesson on data visualization. He wrote about his experience:
I’d love to see a way to make data visualization education a broader part of the curriculum, both on its own and linked with their math and other classes. Imagine adding different shapes to maps in their Social Studies classes to encode data or using waterfall charts in their math classes to visually demonstrate a simple mathematical equation or developing simple network diagrams in science class. The combination of the scientific approach to data visualization and the creativity it sparks could serve as a great way to help students learn.
Maybe I should introduce Schwabish’s Match It Game to the Yau household. My five-year-old has been asking why I keep “doing data.”


