 Plotly, a service that lets you make interactive charts online, open-sourced their main JavaScript charting library.
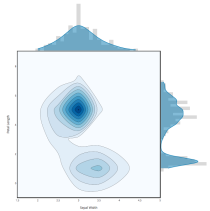
Today, Plotly is announcing that we have open-sourced plotly.js, the core technology and JavaScript graphing library behind Plotly’s products (MIT license). It’s all out there and free. Any developer can now integrate Plotly’s library into their own applications unencumbered. Plotly.js supports 20 chart types, including 3D plots, geographic maps, and statistical charts like density plots, histograms, box plots, and contour plots.
Should be useful if you need some web-based, interactive charts in a pinch.

