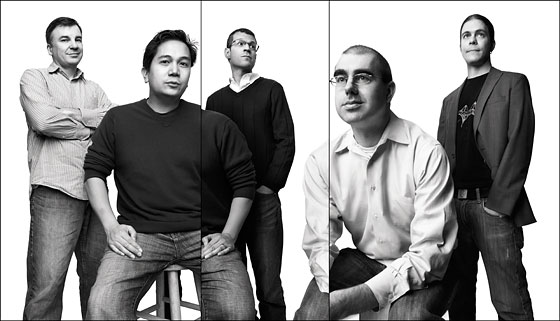
Leading up to their book, Turning Pages: Editorial Design for Print Media, publisher Gestalten has a chat with Steve Duenes and Archie Tse — of famed New York Times graphics department — about what goes on behind the scenes.
They’ve won countless awards for their graphic work, but now it’s time to dive behind what makes America’s most venerated general interest newspaper stand a world apart. Graphics director Steve Duenes and his team of 30-some journalists at The New York Times turn around images at a breakneck daily, if not an hourly, pace, sorting and sifting through reportage to provide the clearest visualization of data possible.
What most people don’t know is that there’s a lot of work, fact-checking, and reporting that goes into each graphic, and the fine NYT group does it all. It’s this attention to detail that sets them apart from the rest. Well, that and people who are extremely good at what they do and have fun doing it.
To this day, there hasn’t been a class or experience that has taught me more about graphics and visualization than my three months interning over there.
I think one of the things that surprised me the most was how laid back everyone is. You always imagine a news room as a guy busting through a door with a big story, and all hell breaking loose. It’s not like that at all. It’s one five-minute stand-up circle meeting in the morning and everyone goes about their business. They also like to eat lunch early and have an affinity for Chipotle.
Anyways, I digress. Watch Steve and Archie talk about how The New York Times graphics department does what it does. Enjoy.
[via infosthetics]
*Photo by Mike McGregor


 Visualize This: The FlowingData Guide to Design, Visualization, and Statistics (2nd Edition)

I was hoping to hear about the technologies that they are using
From what I can remember (in no particular order)…. Ruby on Rails, Flash, Postgres, Postgis, Python, Processing (not regularly), Perl and the kitchen sink.
In their Code – Open Blog ( http://open.blogs.nytimes.com/ ) they write about specific projects and how they were built. The Scoop ( http://blog.thescoop.org/ ) has some info on it too.
Spoken from experience, I see :). There’s also one person who uses a lot of R. They use ArcGIS a lot for maps. For static graphics, everything ends up in Illustrator eventually.
yeah designing is most creative in thing in the world.
“NY web design company
yeah designing is most creative in thing in the world.”
No life is.
I am also curious to hear more about the technologies being used to create different graphics. Thanks!
Is the top graphic depicting the entire graphics department? Are there really only 5 white guys?
Well one of the guys up top is Asian. But actually only the middle one and the one to his right are part of the graphics department: director and deputy director.
The left one is a reporter and the other two do media. They all work together though.
There about 30 people in the graphics department.
Pingback: NYTimes.com Transcends our Concept of “The Newspaper” « Taking Aim