
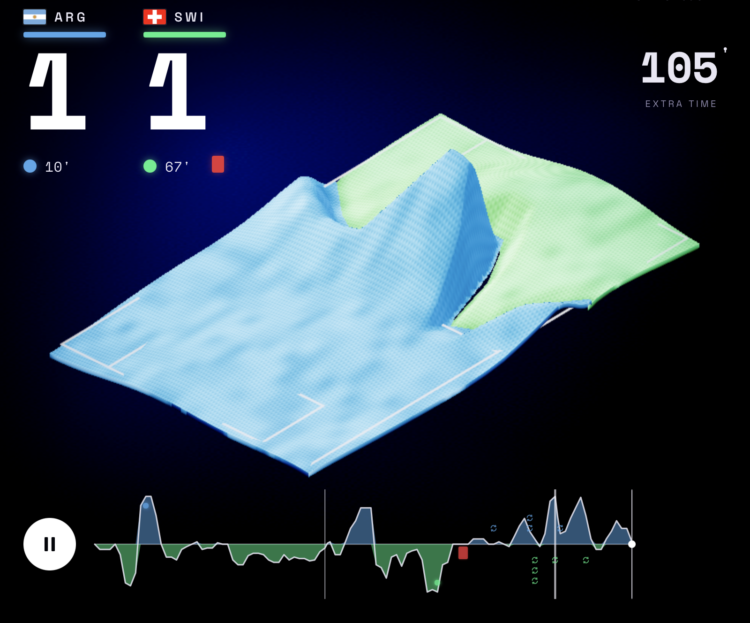
Alexander Bogachev is making animated data portraits for each match:
A football match is one of the densest data objects in sport: thousands of passes, hundreds of shots, ninety minutes of shifting pressure. Most visualisations flatten all of that into charts a specialist has to decode. Data Portraits does the opposite — it turns the whole array back into something everyone already understands: two teams, a pitch, and the feeling of a game swinging one way and then the other.
A border line indicates which team is pressing, hills move up when shots are made, and spikes pop when goals are scored.
 Visualize This: The FlowingData Guide to Design, Visualization, and Statistics (2nd Edition)
