How Much Alcohol Americans Drink

Just under half of adults in the United States said they had an alcoholic beverage in the past 30 days, based on 2024 data from the Behavioral Risk Factor Surveillance System.
Does this change for various groups? Of course.
About 42% of women versus 52% of men said they drink, as shown in the following chart.
Had at least one alcoholic beverage
We can go further down by splitting by sex and age group. See how it shifts:
Less drinking as we get older
Legal drinking age in the United States is 21 years, so it makes sense that the youngest group from 18 to 24 showed a lower percentage of people who drank. The survey data doesn’t provide exact age, but I suspect a smaller subgroup from 21 to 24 would increase that percentage.
In any case, drinking increases in our 20s and declines steadily after. This seems right anecdotally, says this man approaching his mid-40s. That second or third beer just doesn’t seem as appealing as the first.
Of those who drink, how many drinks do they consume on average in a day? Women said usually one and men mostly said two, but both lean a lot more heavily towards one drink on average when we get past 50 years old.
How many alcoholic beverages
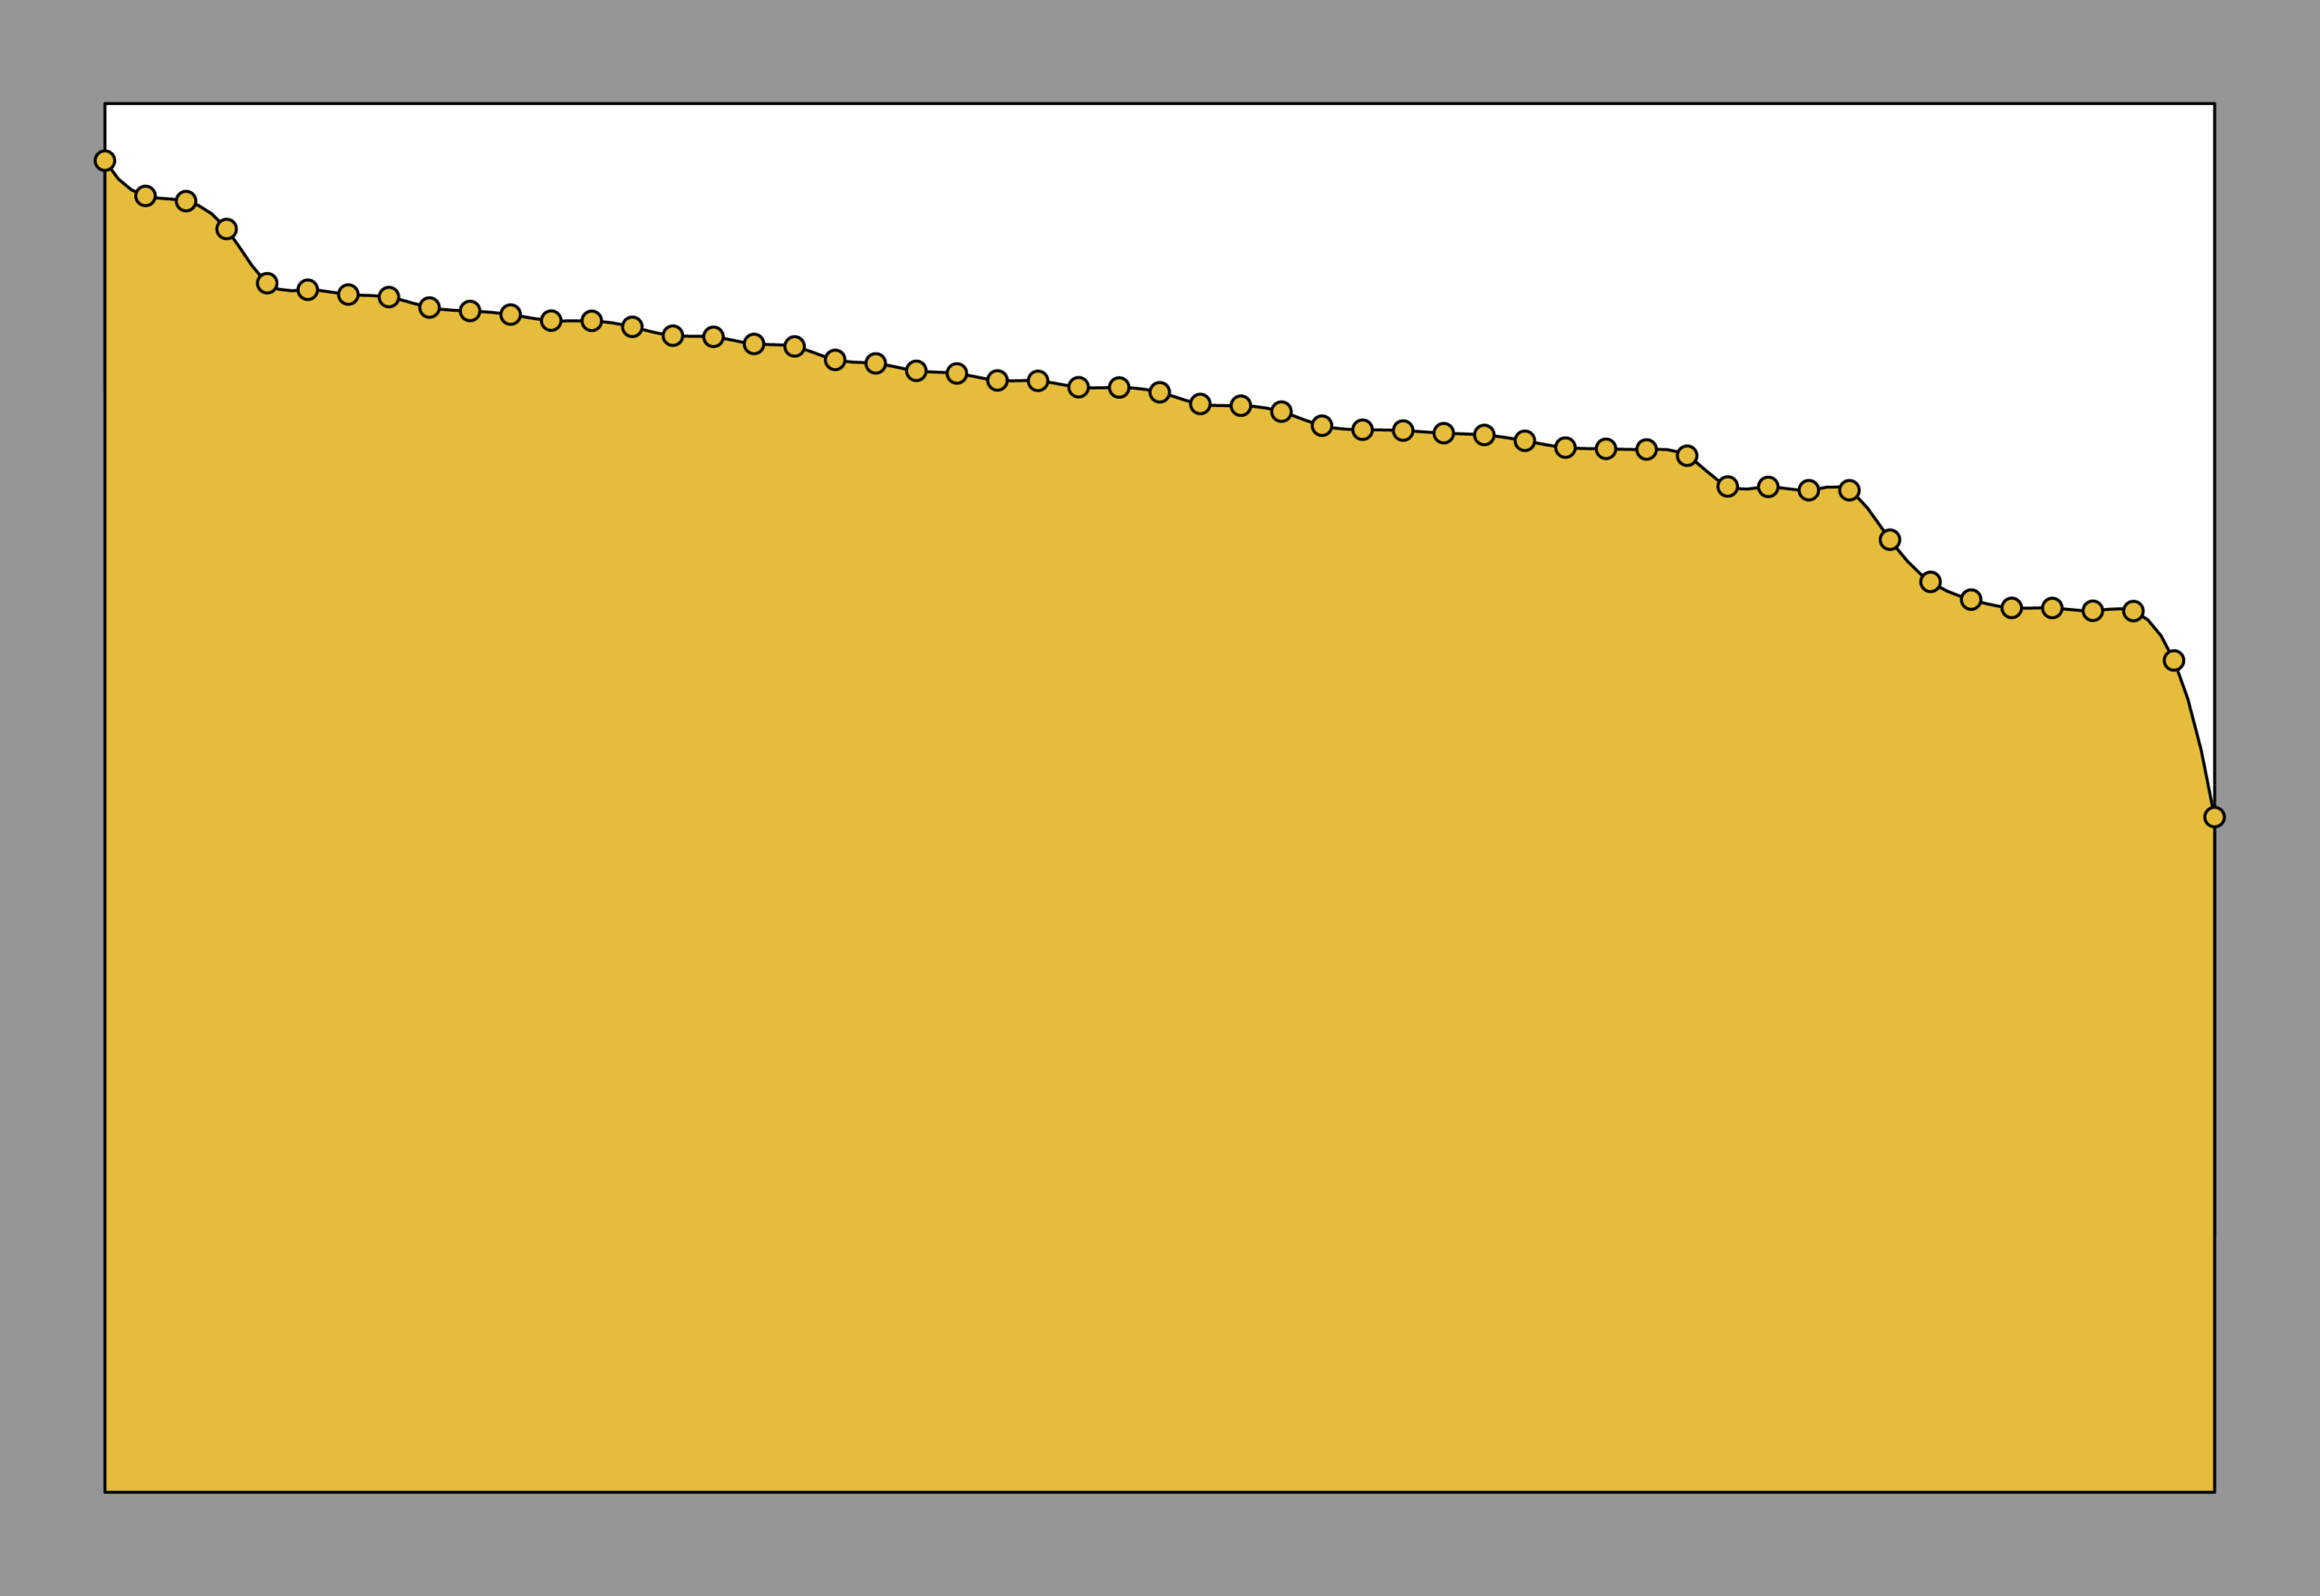
Finally, just because we can, let’s see the percentage of people who said they drank in each state. What states drink the most?
Had at least one alcoholic beverage, by state
I’ve never been to Vermont or New Hampshire, but seeing these two states at the top caught me off guard. I kind of want to check them out now.
Washington, D.C. is a city so that was expected. Utah has different drinking laws from most states, so seeing them at the bottom was also expected.
Overall, I thought the percentages would be higher. There are several states below the halfway mark. But maybe that says more about me. I wonder how much drinking habits have changed over decades.
Analyze, visualize, and communicate data usefully — beyond the defaults. Become a member →


