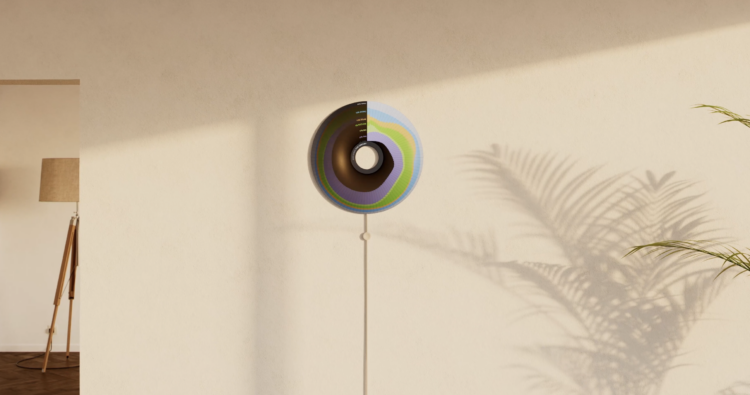
Currently is a prototype ambient display that shows where your energy comes from. The display cycles through a set of radial stacked charts that provide the breakdown over time.
It reminds me of eco-related projects from the late 2000s. I like it.
Currently is a prototype ambient display that shows where your energy comes from. The display cycles through a set of radial stacked charts that provide the breakdown over time.
It reminds me of eco-related projects from the late 2000s. I like it.
 Visualize This: The FlowingData Guide to Design, Visualization, and Statistics (2nd Edition)
New tools, refined process.