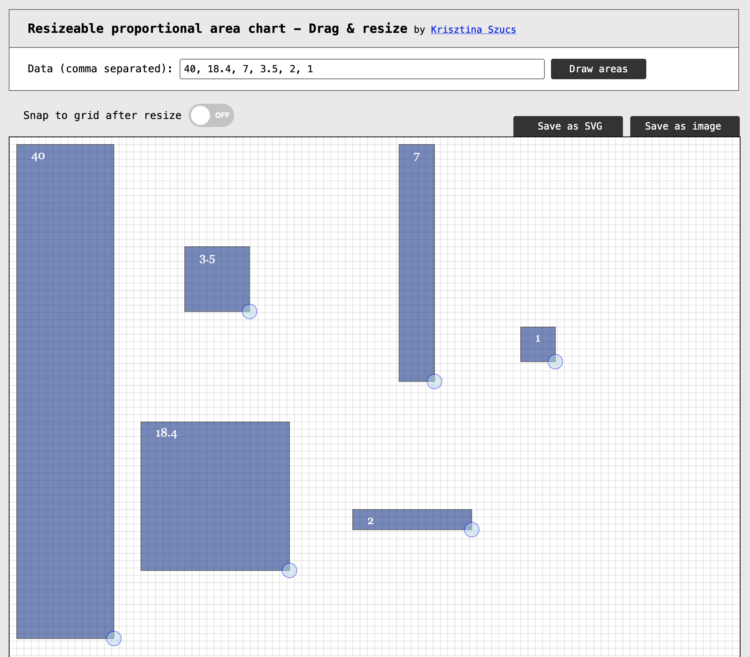
There might be times when you want to visualize data with area, but want to use irregular shapes that aren’t strictly squares. This straightforward tool by Krisztina Szucs lets click-and-drag for custom shapes. Enter values and drag the corners to make longer, shorter, wider, and narrower.
Simple tool for proportional area charts
Second Edition
 Visualize This: The FlowingData Guide to Design, Visualization, and Statistics (2nd Edition)
 Visualize This: The FlowingData Guide to Design, Visualization, and Statistics (2nd Edition)
New tools, refined process.